Italian vs Subsaharan African Unemployment Among Youth under 25 years
COMPARE
Italian
Subsaharan African
Unemployment Among Youth under 25 years
Unemployment Among Youth under 25 years Comparison
Italians
Sub-Saharan Africans
11.4%
UNEMPLOYMENT AMONG YOUTH UNDER 25 YEARS
87.2/ 100
METRIC RATING
124th/ 347
METRIC RANK
12.6%
UNEMPLOYMENT AMONG YOUTH UNDER 25 YEARS
0.0/ 100
METRIC RATING
267th/ 347
METRIC RANK
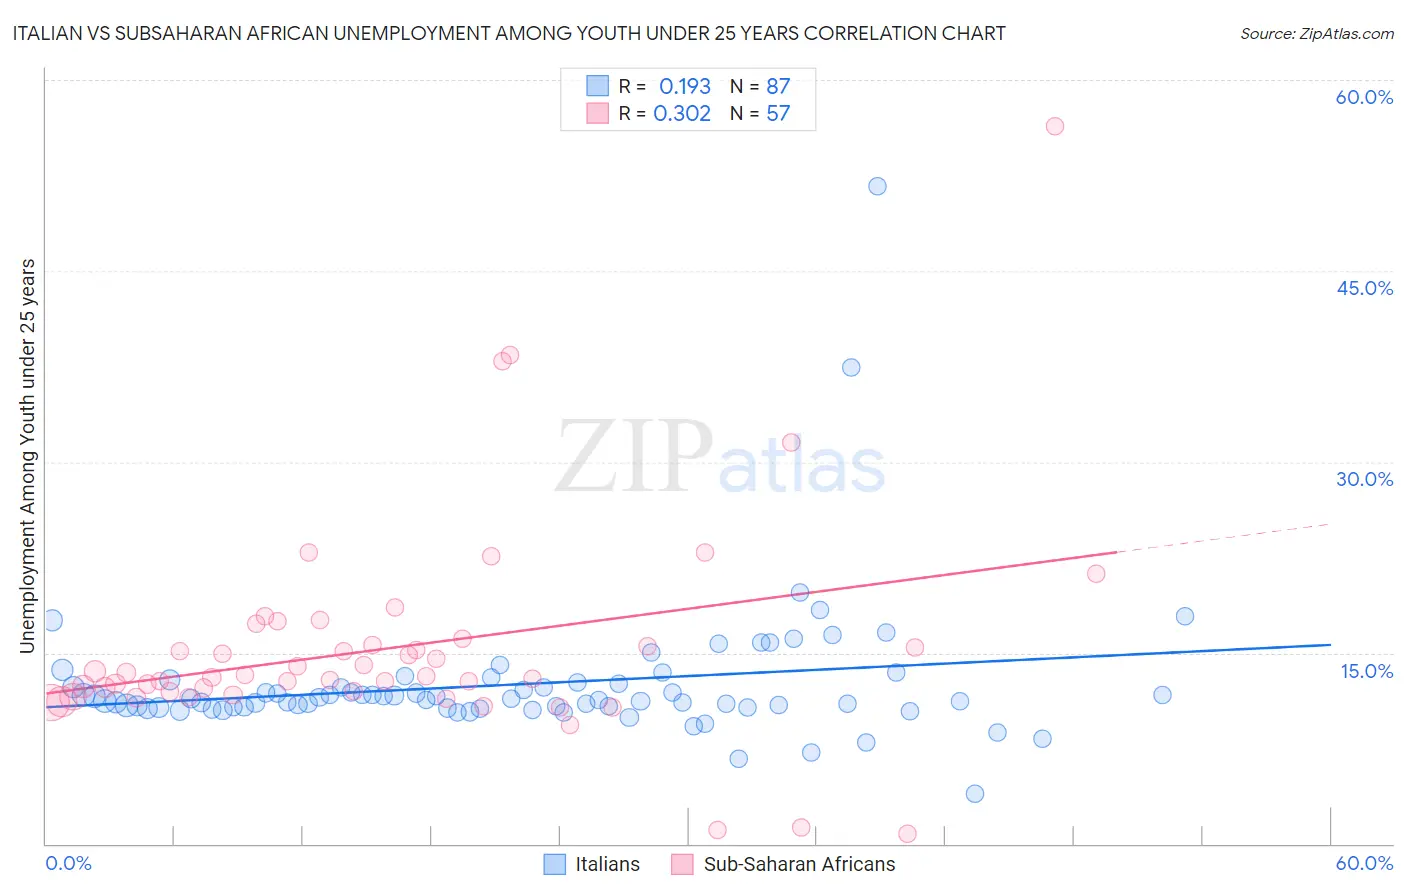
Italian vs Subsaharan African Unemployment Among Youth under 25 years Correlation Chart
The statistical analysis conducted on geographies consisting of 549,839,385 people shows a poor positive correlation between the proportion of Italians and unemployment rate among youth under the age of 25 in the United States with a correlation coefficient (R) of 0.193 and weighted average of 11.4%. Similarly, the statistical analysis conducted on geographies consisting of 498,174,869 people shows a mild positive correlation between the proportion of Sub-Saharan Africans and unemployment rate among youth under the age of 25 in the United States with a correlation coefficient (R) of 0.302 and weighted average of 12.6%, a difference of 11.2%.
Unemployment Among Youth under 25 years Correlation Summary
| Measurement | Italian | Subsaharan African |
| Minimum | 3.9% | 0.80% |
| Maximum | 51.7% | 56.4% |
| Range | 47.8% | 55.6% |
| Mean | 12.5% | 15.4% |
| Median | 11.3% | 13.1% |
| Interquartile 25% (IQ1) | 10.7% | 11.8% |
| Interquartile 75% (IQ3) | 12.6% | 15.8% |
| Interquartile Range (IQR) | 1.8% | 4.0% |
| Standard Deviation (Sample) | 5.6% | 8.6% |
| Standard Deviation (Population) | 5.6% | 8.6% |
Similar Demographics by Unemployment Among Youth under 25 years
Demographics Similar to Italians by Unemployment Among Youth under 25 years
In terms of unemployment among youth under 25 years, the demographic groups most similar to Italians are Immigrants from Argentina (11.4%, a difference of 0.0%), Canadian (11.4%, a difference of 0.050%), Basque (11.4%, a difference of 0.060%), Immigrants from Micronesia (11.4%, a difference of 0.090%), and Greek (11.4%, a difference of 0.090%).
| Demographics | Rating | Rank | Unemployment Among Youth under 25 years |
| Sri Lankans | 89.8 /100 | #117 | Excellent 11.3% |
| Afghans | 89.7 /100 | #118 | Excellent 11.3% |
| Immigrants | Scotland | 89.2 /100 | #119 | Excellent 11.4% |
| Malaysians | 89.0 /100 | #120 | Excellent 11.4% |
| Slovaks | 88.9 /100 | #121 | Excellent 11.4% |
| Immigrants | Micronesia | 88.1 /100 | #122 | Excellent 11.4% |
| Basques | 87.8 /100 | #123 | Excellent 11.4% |
| Italians | 87.2 /100 | #124 | Excellent 11.4% |
| Immigrants | Argentina | 87.2 /100 | #125 | Excellent 11.4% |
| Canadians | 86.6 /100 | #126 | Excellent 11.4% |
| Greeks | 86.2 /100 | #127 | Excellent 11.4% |
| Immigrants | Hungary | 86.0 /100 | #128 | Excellent 11.4% |
| Turks | 85.8 /100 | #129 | Excellent 11.4% |
| Hungarians | 85.7 /100 | #130 | Excellent 11.4% |
| Immigrants | Spain | 84.6 /100 | #131 | Excellent 11.4% |
Demographics Similar to Sub-Saharan Africans by Unemployment Among Youth under 25 years
In terms of unemployment among youth under 25 years, the demographic groups most similar to Sub-Saharan Africans are Tlingit-Haida (12.7%, a difference of 0.080%), Immigrants from Latin America (12.6%, a difference of 0.13%), Kiowa (12.7%, a difference of 0.20%), Nepalese (12.5%, a difference of 1.0%), and Puget Sound Salish (12.5%, a difference of 1.1%).
| Demographics | Rating | Rank | Unemployment Among Youth under 25 years |
| Immigrants | Panama | 0.1 /100 | #260 | Tragic 12.4% |
| Immigrants | El Salvador | 0.1 /100 | #261 | Tragic 12.4% |
| Immigrants | Mexico | 0.1 /100 | #262 | Tragic 12.4% |
| Cree | 0.1 /100 | #263 | Tragic 12.4% |
| Puget Sound Salish | 0.1 /100 | #264 | Tragic 12.5% |
| Nepalese | 0.0 /100 | #265 | Tragic 12.5% |
| Immigrants | Latin America | 0.0 /100 | #266 | Tragic 12.6% |
| Sub-Saharan Africans | 0.0 /100 | #267 | Tragic 12.6% |
| Tlingit-Haida | 0.0 /100 | #268 | Tragic 12.7% |
| Kiowa | 0.0 /100 | #269 | Tragic 12.7% |
| Immigrants | Liberia | 0.0 /100 | #270 | Tragic 12.8% |
| Immigrants | Bahamas | 0.0 /100 | #271 | Tragic 12.9% |
| Cape Verdeans | 0.0 /100 | #272 | Tragic 12.9% |
| Nigerians | 0.0 /100 | #273 | Tragic 13.0% |
| Immigrants | Nigeria | 0.0 /100 | #274 | Tragic 13.0% |