Italian vs Hopi Unemployment Among Ages 30 to 34 years
COMPARE
Italian
Hopi
Unemployment Among Ages 30 to 34 years
Unemployment Among Ages 30 to 34 years Comparison
Italians
Hopi
5.5%
UNEMPLOYMENT AMONG AGES 30 TO 34 YEARS
45.5/ 100
METRIC RATING
180th/ 347
METRIC RANK
11.9%
UNEMPLOYMENT AMONG AGES 30 TO 34 YEARS
0.0/ 100
METRIC RATING
344th/ 347
METRIC RANK
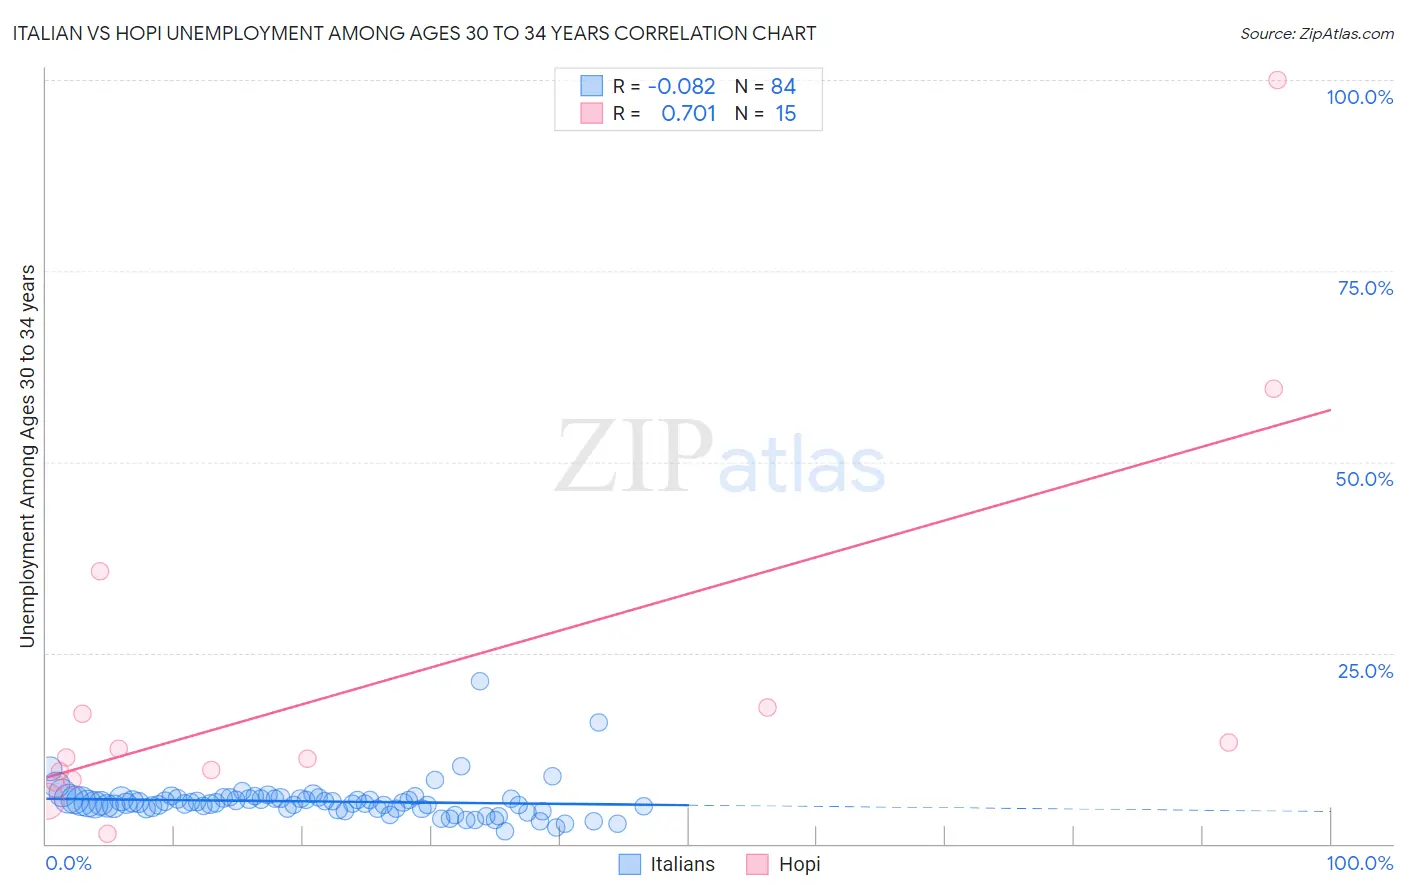
Italian vs Hopi Unemployment Among Ages 30 to 34 years Correlation Chart
The statistical analysis conducted on geographies consisting of 501,232,978 people shows a slight negative correlation between the proportion of Italians and unemployment rate among population between the ages 30 and 34 in the United States with a correlation coefficient (R) of -0.082 and weighted average of 5.5%. Similarly, the statistical analysis conducted on geographies consisting of 73,932,121 people shows a strong positive correlation between the proportion of Hopi and unemployment rate among population between the ages 30 and 34 in the United States with a correlation coefficient (R) of 0.701 and weighted average of 11.9%, a difference of 117.9%.
Unemployment Among Ages 30 to 34 years Correlation Summary
| Measurement | Italian | Hopi |
| Minimum | 1.6% | 1.3% |
| Maximum | 21.3% | 100.0% |
| Range | 19.7% | 98.7% |
| Mean | 5.5% | 21.4% |
| Median | 5.3% | 11.3% |
| Interquartile 25% (IQ1) | 4.6% | 8.4% |
| Interquartile 75% (IQ3) | 5.9% | 17.8% |
| Interquartile Range (IQR) | 1.3% | 9.4% |
| Standard Deviation (Sample) | 2.5% | 26.1% |
| Standard Deviation (Population) | 2.5% | 25.2% |
Similar Demographics by Unemployment Among Ages 30 to 34 years
Demographics Similar to Italians by Unemployment Among Ages 30 to 34 years
In terms of unemployment among ages 30 to 34 years, the demographic groups most similar to Italians are Costa Rican (5.5%, a difference of 0.090%), Macedonian (5.5%, a difference of 0.11%), Immigrants from Lebanon (5.5%, a difference of 0.14%), Immigrants from Denmark (5.5%, a difference of 0.15%), and Immigrants from Ukraine (5.5%, a difference of 0.16%).
| Demographics | Rating | Rank | Unemployment Among Ages 30 to 34 years |
| Peruvians | 50.2 /100 | #173 | Average 5.5% |
| Immigrants | Laos | 50.0 /100 | #174 | Average 5.5% |
| Afghans | 49.6 /100 | #175 | Average 5.5% |
| Immigrants | Peru | 48.0 /100 | #176 | Average 5.5% |
| Immigrants | Ukraine | 47.7 /100 | #177 | Average 5.5% |
| Macedonians | 47.1 /100 | #178 | Average 5.5% |
| Costa Ricans | 46.7 /100 | #179 | Average 5.5% |
| Italians | 45.5 /100 | #180 | Average 5.5% |
| Immigrants | Lebanon | 43.5 /100 | #181 | Average 5.5% |
| Immigrants | Denmark | 43.4 /100 | #182 | Average 5.5% |
| Hungarians | 43.1 /100 | #183 | Average 5.5% |
| Malaysians | 41.8 /100 | #184 | Average 5.5% |
| Immigrants | Western Europe | 39.1 /100 | #185 | Fair 5.5% |
| Canadians | 38.2 /100 | #186 | Fair 5.5% |
| Immigrants | Western Asia | 38.2 /100 | #187 | Fair 5.5% |
Demographics Similar to Hopi by Unemployment Among Ages 30 to 34 years
In terms of unemployment among ages 30 to 34 years, the demographic groups most similar to Hopi are Arapaho (12.8%, a difference of 7.4%), Inupiat (10.8%, a difference of 10.3%), Yuman (10.6%, a difference of 12.7%), Navajo (10.6%, a difference of 13.1%), and Tsimshian (13.8%, a difference of 15.3%).
| Demographics | Rating | Rank | Unemployment Among Ages 30 to 34 years |
| Pueblo | 0.0 /100 | #333 | Tragic 8.3% |
| Alaska Natives | 0.0 /100 | #334 | Tragic 8.5% |
| Puerto Ricans | 0.0 /100 | #335 | Tragic 8.9% |
| Colville | 0.0 /100 | #336 | Tragic 9.0% |
| Pima | 0.0 /100 | #337 | Tragic 9.6% |
| Yakama | 0.0 /100 | #338 | Tragic 9.8% |
| Tohono O'odham | 0.0 /100 | #339 | Tragic 9.8% |
| Crow | 0.0 /100 | #340 | Tragic 10.3% |
| Navajo | 0.0 /100 | #341 | Tragic 10.6% |
| Yuman | 0.0 /100 | #342 | Tragic 10.6% |
| Inupiat | 0.0 /100 | #343 | Tragic 10.8% |
| Hopi | 0.0 /100 | #344 | Tragic 11.9% |
| Arapaho | 0.0 /100 | #345 | Tragic 12.8% |
| Tsimshian | 0.0 /100 | #346 | Tragic 13.8% |
| Yup'ik | 0.0 /100 | #347 | Tragic 18.5% |