Israeli vs Immigrants from Syria Unemployment Among Ages 16 to 19 years
COMPARE
Israeli
Immigrants from Syria
Unemployment Among Ages 16 to 19 years
Unemployment Among Ages 16 to 19 years Comparison
Israelis
Immigrants from Syria
19.0%
UNEMPLOYMENT AMONG AGES 16 TO 19 YEARS
0.1/ 100
METRIC RATING
267th/ 347
METRIC RANK
18.0%
UNEMPLOYMENT AMONG AGES 16 TO 19 YEARS
13.3/ 100
METRIC RATING
215th/ 347
METRIC RANK
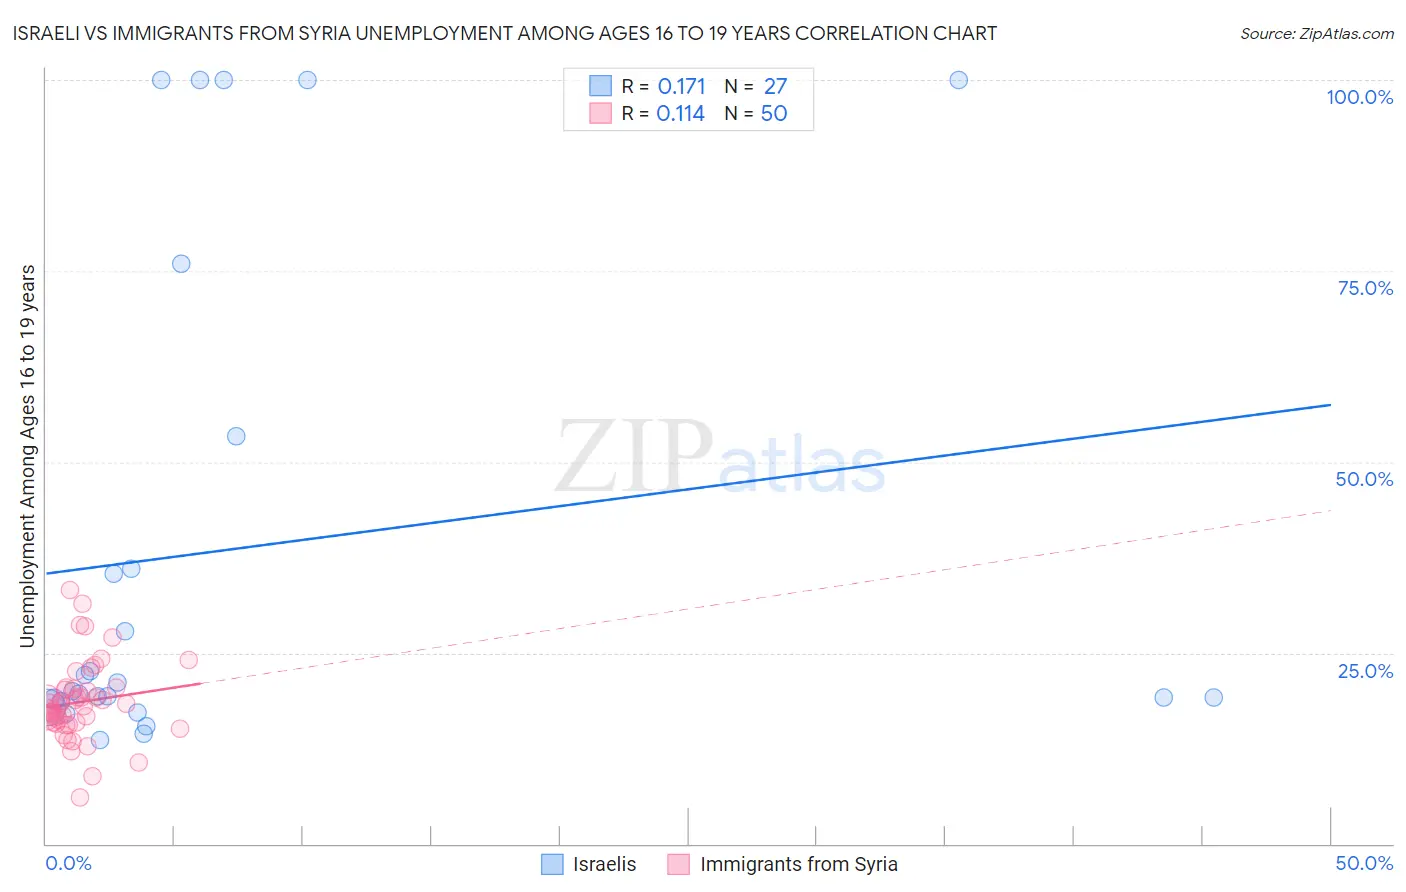
Israeli vs Immigrants from Syria Unemployment Among Ages 16 to 19 years Correlation Chart
The statistical analysis conducted on geographies consisting of 204,167,490 people shows a poor positive correlation between the proportion of Israelis and unemployment rate among population between the ages 16 and 19 in the United States with a correlation coefficient (R) of 0.171 and weighted average of 19.0%. Similarly, the statistical analysis conducted on geographies consisting of 170,053,940 people shows a poor positive correlation between the proportion of Immigrants from Syria and unemployment rate among population between the ages 16 and 19 in the United States with a correlation coefficient (R) of 0.114 and weighted average of 18.0%, a difference of 6.0%.
Unemployment Among Ages 16 to 19 years Correlation Summary
| Measurement | Israeli | Immigrants from Syria |
| Minimum | 13.6% | 6.0% |
| Maximum | 100.0% | 33.2% |
| Range | 86.4% | 27.2% |
| Mean | 38.7% | 18.6% |
| Median | 20.0% | 18.1% |
| Interquartile 25% (IQ1) | 18.7% | 15.8% |
| Interquartile 75% (IQ3) | 53.3% | 20.2% |
| Interquartile Range (IQR) | 34.6% | 4.4% |
| Standard Deviation (Sample) | 32.5% | 5.2% |
| Standard Deviation (Population) | 31.9% | 5.2% |
Similar Demographics by Unemployment Among Ages 16 to 19 years
Demographics Similar to Israelis by Unemployment Among Ages 16 to 19 years
In terms of unemployment among ages 16 to 19 years, the demographic groups most similar to Israelis are Immigrants from El Salvador (19.1%, a difference of 0.28%), Immigrants from Honduras (19.0%, a difference of 0.34%), Lumbee (19.1%, a difference of 0.36%), Choctaw (19.0%, a difference of 0.43%), and Yaqui (19.0%, a difference of 0.45%).
| Demographics | Rating | Rank | Unemployment Among Ages 16 to 19 years |
| Nigerians | 0.2 /100 | #260 | Tragic 18.9% |
| Spanish American Indians | 0.1 /100 | #261 | Tragic 18.9% |
| Salvadorans | 0.1 /100 | #262 | Tragic 18.9% |
| Cree | 0.1 /100 | #263 | Tragic 19.0% |
| Yaqui | 0.1 /100 | #264 | Tragic 19.0% |
| Choctaw | 0.1 /100 | #265 | Tragic 19.0% |
| Immigrants | Honduras | 0.1 /100 | #266 | Tragic 19.0% |
| Israelis | 0.1 /100 | #267 | Tragic 19.0% |
| Immigrants | El Salvador | 0.1 /100 | #268 | Tragic 19.1% |
| Lumbee | 0.1 /100 | #269 | Tragic 19.1% |
| Hondurans | 0.1 /100 | #270 | Tragic 19.2% |
| Blackfeet | 0.0 /100 | #271 | Tragic 19.2% |
| Hispanics or Latinos | 0.0 /100 | #272 | Tragic 19.2% |
| Immigrants | Panama | 0.0 /100 | #273 | Tragic 19.3% |
| Shoshone | 0.0 /100 | #274 | Tragic 19.3% |
Demographics Similar to Immigrants from Syria by Unemployment Among Ages 16 to 19 years
In terms of unemployment among ages 16 to 19 years, the demographic groups most similar to Immigrants from Syria are Immigrants from Morocco (18.0%, a difference of 0.020%), Immigrants from Kazakhstan (18.0%, a difference of 0.030%), Chippewa (18.0%, a difference of 0.040%), South American Indian (18.0%, a difference of 0.040%), and Argentinean (18.0%, a difference of 0.050%).
| Demographics | Rating | Rank | Unemployment Among Ages 16 to 19 years |
| Hawaiians | 16.8 /100 | #208 | Poor 17.9% |
| Cherokee | 15.7 /100 | #209 | Poor 17.9% |
| Carpatho Rusyns | 15.6 /100 | #210 | Poor 17.9% |
| Guamanians/Chamorros | 14.5 /100 | #211 | Poor 17.9% |
| Argentineans | 13.8 /100 | #212 | Poor 18.0% |
| Chippewa | 13.7 /100 | #213 | Poor 18.0% |
| Immigrants | Morocco | 13.5 /100 | #214 | Poor 18.0% |
| Immigrants | Syria | 13.3 /100 | #215 | Poor 18.0% |
| Immigrants | Kazakhstan | 13.0 /100 | #216 | Poor 18.0% |
| South American Indians | 13.0 /100 | #217 | Poor 18.0% |
| Immigrants | Argentina | 12.5 /100 | #218 | Poor 18.0% |
| Immigrants | Africa | 12.0 /100 | #219 | Poor 18.0% |
| Immigrants | Albania | 11.4 /100 | #220 | Poor 18.0% |
| Immigrants | Spain | 11.4 /100 | #221 | Poor 18.0% |
| Immigrants | Iran | 10.7 /100 | #222 | Poor 18.0% |