Iroquois vs Pakistani Male Unemployment
COMPARE
Iroquois
Pakistani
Male Unemployment
Male Unemployment Comparison
Iroquois
Pakistanis
5.7%
MALE UNEMPLOYMENT
0.6/ 100
METRIC RATING
246th/ 347
METRIC RANK
5.2%
MALE UNEMPLOYMENT
80.5/ 100
METRIC RATING
134th/ 347
METRIC RANK
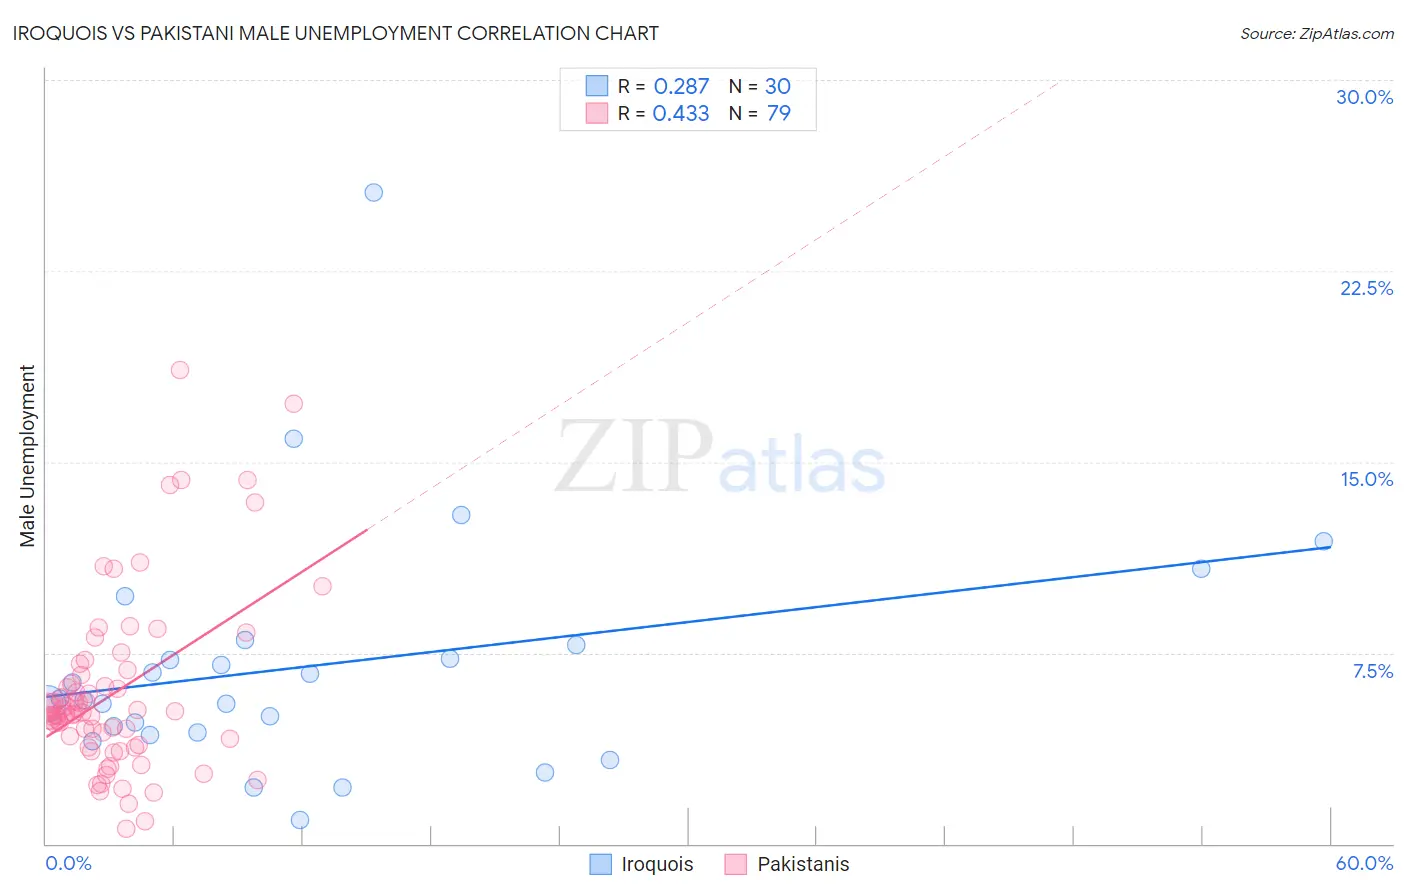
Iroquois vs Pakistani Male Unemployment Correlation Chart
The statistical analysis conducted on geographies consisting of 206,667,953 people shows a weak positive correlation between the proportion of Iroquois and unemployment rate among males in the United States with a correlation coefficient (R) of 0.287 and weighted average of 5.7%. Similarly, the statistical analysis conducted on geographies consisting of 334,491,221 people shows a moderate positive correlation between the proportion of Pakistanis and unemployment rate among males in the United States with a correlation coefficient (R) of 0.433 and weighted average of 5.2%, a difference of 9.7%.
Male Unemployment Correlation Summary
| Measurement | Iroquois | Pakistani |
| Minimum | 0.95% | 0.60% |
| Maximum | 25.6% | 18.6% |
| Range | 24.6% | 18.0% |
| Mean | 7.0% | 5.9% |
| Median | 5.7% | 5.1% |
| Interquartile 25% (IQ1) | 4.4% | 3.9% |
| Interquartile 75% (IQ3) | 7.8% | 6.6% |
| Interquartile Range (IQR) | 3.4% | 2.7% |
| Standard Deviation (Sample) | 4.8% | 3.5% |
| Standard Deviation (Population) | 4.7% | 3.5% |
Similar Demographics by Male Unemployment
Demographics Similar to Iroquois by Male Unemployment
In terms of male unemployment, the demographic groups most similar to Iroquois are Yaqui (5.7%, a difference of 0.090%), Hawaiian (5.7%, a difference of 0.10%), Immigrants from El Salvador (5.7%, a difference of 0.26%), Bangladeshi (5.7%, a difference of 0.30%), and Marshallese (5.7%, a difference of 0.41%).
| Demographics | Rating | Rank | Male Unemployment |
| Immigrants | Guatemala | 1.1 /100 | #239 | Tragic 5.6% |
| Immigrants | Cameroon | 1.0 /100 | #240 | Tragic 5.6% |
| Salvadorans | 1.0 /100 | #241 | Tragic 5.7% |
| Ottawa | 0.9 /100 | #242 | Tragic 5.7% |
| Bangladeshis | 0.8 /100 | #243 | Tragic 5.7% |
| Immigrants | El Salvador | 0.7 /100 | #244 | Tragic 5.7% |
| Yaqui | 0.7 /100 | #245 | Tragic 5.7% |
| Iroquois | 0.6 /100 | #246 | Tragic 5.7% |
| Hawaiians | 0.6 /100 | #247 | Tragic 5.7% |
| Marshallese | 0.5 /100 | #248 | Tragic 5.7% |
| Cree | 0.4 /100 | #249 | Tragic 5.7% |
| Immigrants | Bahamas | 0.4 /100 | #250 | Tragic 5.7% |
| Spanish Americans | 0.3 /100 | #251 | Tragic 5.7% |
| Mexicans | 0.2 /100 | #252 | Tragic 5.8% |
| Mexican American Indians | 0.2 /100 | #253 | Tragic 5.8% |
Demographics Similar to Pakistanis by Male Unemployment
In terms of male unemployment, the demographic groups most similar to Pakistanis are Immigrants from Saudi Arabia (5.2%, a difference of 0.030%), Lebanese (5.2%, a difference of 0.050%), Colombian (5.2%, a difference of 0.060%), Immigrants from Eastern Africa (5.2%, a difference of 0.060%), and Immigrants from Croatia (5.2%, a difference of 0.070%).
| Demographics | Rating | Rank | Male Unemployment |
| Immigrants | Brazil | 86.3 /100 | #127 | Excellent 5.2% |
| Hungarians | 85.1 /100 | #128 | Excellent 5.2% |
| Immigrants | Western Europe | 84.8 /100 | #129 | Excellent 5.2% |
| Immigrants | Malaysia | 83.5 /100 | #130 | Excellent 5.2% |
| Immigrants | Germany | 83.0 /100 | #131 | Excellent 5.2% |
| Chickasaw | 82.9 /100 | #132 | Excellent 5.2% |
| Colombians | 81.1 /100 | #133 | Excellent 5.2% |
| Pakistanis | 80.5 /100 | #134 | Excellent 5.2% |
| Immigrants | Saudi Arabia | 80.1 /100 | #135 | Excellent 5.2% |
| Lebanese | 79.9 /100 | #136 | Good 5.2% |
| Immigrants | Eastern Africa | 79.8 /100 | #137 | Good 5.2% |
| Immigrants | Croatia | 79.7 /100 | #138 | Good 5.2% |
| Kenyans | 79.4 /100 | #139 | Good 5.2% |
| Brazilians | 79.3 /100 | #140 | Good 5.2% |
| Immigrants | Switzerland | 79.2 /100 | #141 | Good 5.2% |