Iroquois vs Immigrants from Japan Unemployment Among Ages 30 to 34 years
COMPARE
Iroquois
Immigrants from Japan
Unemployment Among Ages 30 to 34 years
Unemployment Among Ages 30 to 34 years Comparison
Iroquois
Immigrants from Japan
5.9%
UNEMPLOYMENT AMONG AGES 30 TO 34 YEARS
1.0/ 100
METRIC RATING
232nd/ 347
METRIC RANK
5.1%
UNEMPLOYMENT AMONG AGES 30 TO 34 YEARS
96.8/ 100
METRIC RATING
65th/ 347
METRIC RANK
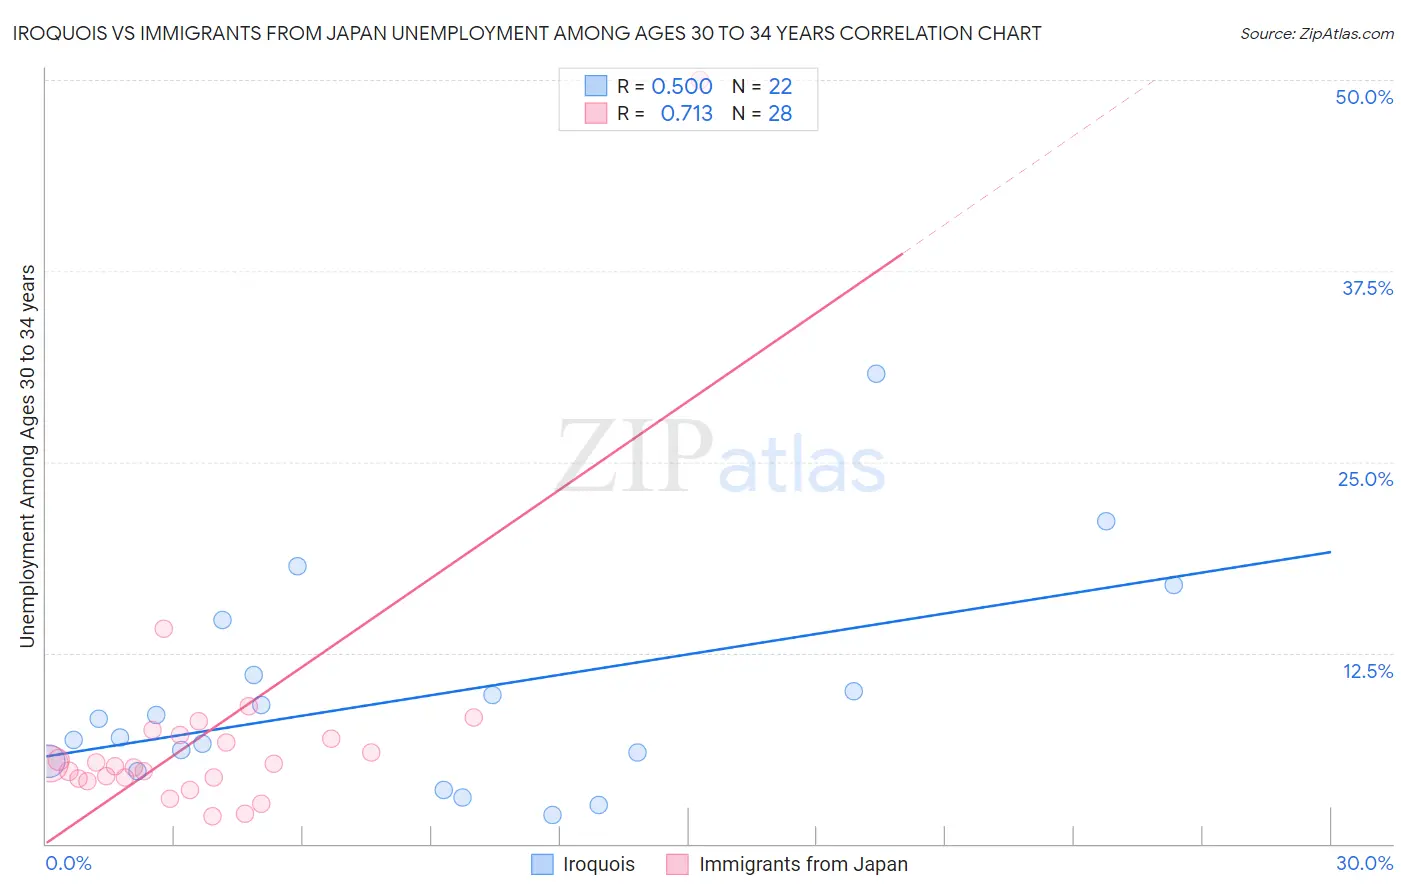
Iroquois vs Immigrants from Japan Unemployment Among Ages 30 to 34 years Correlation Chart
The statistical analysis conducted on geographies consisting of 198,715,109 people shows a moderate positive correlation between the proportion of Iroquois and unemployment rate among population between the ages 30 and 34 in the United States with a correlation coefficient (R) of 0.500 and weighted average of 5.9%. Similarly, the statistical analysis conducted on geographies consisting of 324,511,302 people shows a strong positive correlation between the proportion of Immigrants from Japan and unemployment rate among population between the ages 30 and 34 in the United States with a correlation coefficient (R) of 0.713 and weighted average of 5.1%, a difference of 14.7%.
Unemployment Among Ages 30 to 34 years Correlation Summary
| Measurement | Iroquois | Immigrants from Japan |
| Minimum | 1.9% | 1.8% |
| Maximum | 30.8% | 50.0% |
| Range | 28.9% | 48.2% |
| Mean | 9.6% | 7.1% |
| Median | 7.5% | 5.1% |
| Interquartile 25% (IQ1) | 5.4% | 4.3% |
| Interquartile 75% (IQ3) | 11.1% | 7.0% |
| Interquartile Range (IQR) | 5.7% | 2.7% |
| Standard Deviation (Sample) | 7.0% | 8.8% |
| Standard Deviation (Population) | 6.8% | 8.6% |
Similar Demographics by Unemployment Among Ages 30 to 34 years
Demographics Similar to Iroquois by Unemployment Among Ages 30 to 34 years
In terms of unemployment among ages 30 to 34 years, the demographic groups most similar to Iroquois are Japanese (5.9%, a difference of 0.13%), Hawaiian (5.9%, a difference of 0.26%), Nepalese (5.9%, a difference of 0.38%), Portuguese (5.9%, a difference of 0.41%), and Yaqui (5.9%, a difference of 0.53%).
| Demographics | Rating | Rank | Unemployment Among Ages 30 to 34 years |
| Samoans | 2.5 /100 | #225 | Tragic 5.8% |
| Liberians | 2.3 /100 | #226 | Tragic 5.8% |
| Spanish | 1.8 /100 | #227 | Tragic 5.8% |
| Immigrants | Bahamas | 1.8 /100 | #228 | Tragic 5.8% |
| Immigrants | Uzbekistan | 1.5 /100 | #229 | Tragic 5.9% |
| Hawaiians | 1.2 /100 | #230 | Tragic 5.9% |
| Japanese | 1.1 /100 | #231 | Tragic 5.9% |
| Iroquois | 1.0 /100 | #232 | Tragic 5.9% |
| Nepalese | 0.8 /100 | #233 | Tragic 5.9% |
| Portuguese | 0.8 /100 | #234 | Tragic 5.9% |
| Yaqui | 0.7 /100 | #235 | Tragic 5.9% |
| Native Hawaiians | 0.7 /100 | #236 | Tragic 5.9% |
| Central Americans | 0.6 /100 | #237 | Tragic 5.9% |
| Mexican American Indians | 0.6 /100 | #238 | Tragic 5.9% |
| Immigrants | Nigeria | 0.6 /100 | #239 | Tragic 6.0% |
Demographics Similar to Immigrants from Japan by Unemployment Among Ages 30 to 34 years
In terms of unemployment among ages 30 to 34 years, the demographic groups most similar to Immigrants from Japan are Immigrants from Eastern Asia (5.1%, a difference of 0.070%), Immigrants from Zimbabwe (5.1%, a difference of 0.070%), Belgian (5.1%, a difference of 0.10%), Immigrants from France (5.1%, a difference of 0.11%), and Indian (Asian) (5.1%, a difference of 0.13%).
| Demographics | Rating | Rank | Unemployment Among Ages 30 to 34 years |
| Asians | 97.2 /100 | #58 | Exceptional 5.1% |
| Swedes | 97.1 /100 | #59 | Exceptional 5.1% |
| Immigrants | Somalia | 97.1 /100 | #60 | Exceptional 5.1% |
| Indians (Asian) | 97.0 /100 | #61 | Exceptional 5.1% |
| Immigrants | France | 97.0 /100 | #62 | Exceptional 5.1% |
| Belgians | 97.0 /100 | #63 | Exceptional 5.1% |
| Immigrants | Eastern Asia | 96.9 /100 | #64 | Exceptional 5.1% |
| Immigrants | Japan | 96.8 /100 | #65 | Exceptional 5.1% |
| Immigrants | Zimbabwe | 96.7 /100 | #66 | Exceptional 5.1% |
| Burmese | 96.5 /100 | #67 | Exceptional 5.1% |
| Jordanians | 96.5 /100 | #68 | Exceptional 5.1% |
| Immigrants | Northern Africa | 96.4 /100 | #69 | Exceptional 5.1% |
| Immigrants | Iraq | 96.4 /100 | #70 | Exceptional 5.1% |
| Paraguayans | 96.4 /100 | #71 | Exceptional 5.1% |
| Immigrants | Moldova | 96.4 /100 | #72 | Exceptional 5.1% |