Iroquois vs Hopi Unemployment Among Youth under 25 years
COMPARE
Iroquois
Hopi
Unemployment Among Youth under 25 years
Unemployment Among Youth under 25 years Comparison
Iroquois
Hopi
11.3%
UNEMPLOYMENT AMONG YOUTH UNDER 25 YEARS
93.8/ 100
METRIC RATING
101st/ 347
METRIC RANK
21.5%
UNEMPLOYMENT AMONG YOUTH UNDER 25 YEARS
0.0/ 100
METRIC RATING
345th/ 347
METRIC RANK
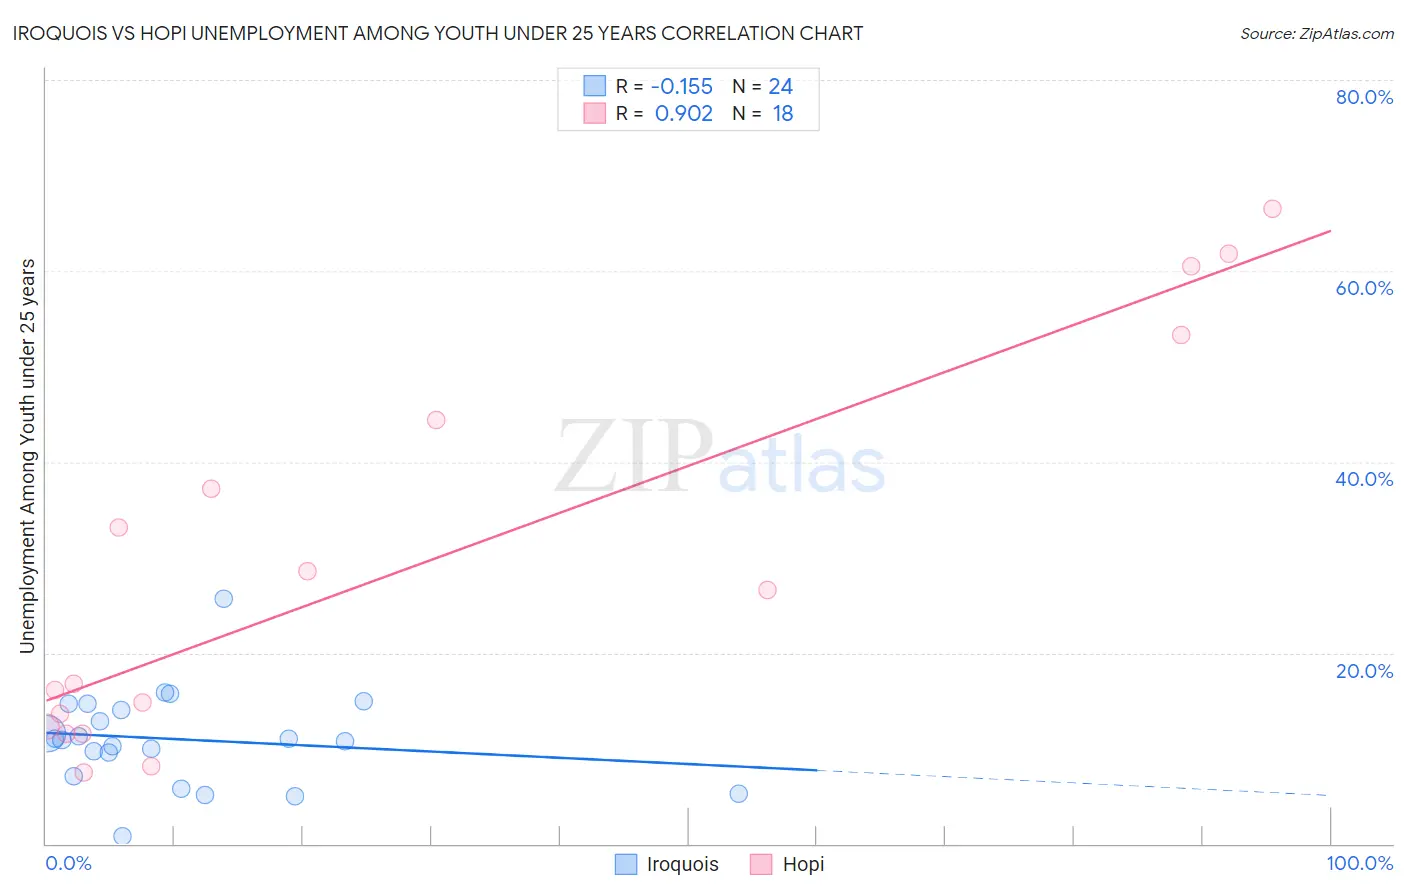
Iroquois vs Hopi Unemployment Among Youth under 25 years Correlation Chart
The statistical analysis conducted on geographies consisting of 205,569,055 people shows a poor negative correlation between the proportion of Iroquois and unemployment rate among youth under the age of 25 in the United States with a correlation coefficient (R) of -0.155 and weighted average of 11.3%. Similarly, the statistical analysis conducted on geographies consisting of 74,569,611 people shows a near-perfect positive correlation between the proportion of Hopi and unemployment rate among youth under the age of 25 in the United States with a correlation coefficient (R) of 0.902 and weighted average of 21.5%, a difference of 90.3%.
Unemployment Among Youth under 25 years Correlation Summary
| Measurement | Iroquois | Hopi |
| Minimum | 0.80% | 7.5% |
| Maximum | 25.7% | 66.5% |
| Range | 24.9% | 59.0% |
| Mean | 11.0% | 29.1% |
| Median | 10.9% | 21.7% |
| Interquartile 25% (IQ1) | 8.3% | 12.3% |
| Interquartile 75% (IQ3) | 14.3% | 44.4% |
| Interquartile Range (IQR) | 6.0% | 32.1% |
| Standard Deviation (Sample) | 5.0% | 20.2% |
| Standard Deviation (Population) | 4.9% | 19.6% |
Similar Demographics by Unemployment Among Youth under 25 years
Demographics Similar to Iroquois by Unemployment Among Youth under 25 years
In terms of unemployment among youth under 25 years, the demographic groups most similar to Iroquois are Pakistani (11.3%, a difference of 0.020%), Celtic (11.3%, a difference of 0.030%), Immigrants from Thailand (11.3%, a difference of 0.050%), Immigrants from Malaysia (11.3%, a difference of 0.050%), and Immigrants from Afghanistan (11.3%, a difference of 0.070%).
| Demographics | Rating | Rank | Unemployment Among Youth under 25 years |
| Lithuanians | 94.8 /100 | #94 | Exceptional 11.3% |
| Carpatho Rusyns | 94.4 /100 | #95 | Exceptional 11.3% |
| Immigrants | Serbia | 94.4 /100 | #96 | Exceptional 11.3% |
| Nicaraguans | 94.3 /100 | #97 | Exceptional 11.3% |
| Estonians | 94.2 /100 | #98 | Exceptional 11.3% |
| Celtics | 94.0 /100 | #99 | Exceptional 11.3% |
| Pakistanis | 94.0 /100 | #100 | Exceptional 11.3% |
| Iroquois | 93.8 /100 | #101 | Exceptional 11.3% |
| Immigrants | Thailand | 93.6 /100 | #102 | Exceptional 11.3% |
| Immigrants | Malaysia | 93.6 /100 | #103 | Exceptional 11.3% |
| Immigrants | Afghanistan | 93.4 /100 | #104 | Exceptional 11.3% |
| Immigrants | Jordan | 93.1 /100 | #105 | Exceptional 11.3% |
| Chileans | 93.0 /100 | #106 | Exceptional 11.3% |
| Immigrants | Lithuania | 92.9 /100 | #107 | Exceptional 11.3% |
| Immigrants | Kuwait | 92.9 /100 | #108 | Exceptional 11.3% |
Demographics Similar to Hopi by Unemployment Among Youth under 25 years
In terms of unemployment among youth under 25 years, the demographic groups most similar to Hopi are Inupiat (22.0%, a difference of 2.5%), Crow (20.1%, a difference of 7.0%), Yup'ik (23.7%, a difference of 10.6%), Navajo (18.6%, a difference of 15.3%), and Puerto Rican (18.4%, a difference of 16.6%).
| Demographics | Rating | Rank | Unemployment Among Youth under 25 years |
| Guyanese | 0.0 /100 | #333 | Tragic 15.9% |
| Immigrants | Guyana | 0.0 /100 | #334 | Tragic 15.9% |
| Immigrants | St. Vincent and the Grenadines | 0.0 /100 | #335 | Tragic 16.1% |
| Pima | 0.0 /100 | #336 | Tragic 16.2% |
| Arapaho | 0.0 /100 | #337 | Tragic 16.3% |
| Yuman | 0.0 /100 | #338 | Tragic 16.3% |
| Tsimshian | 0.0 /100 | #339 | Tragic 16.5% |
| Colville | 0.0 /100 | #340 | Tragic 16.8% |
| Paiute | 0.0 /100 | #341 | Tragic 17.6% |
| Puerto Ricans | 0.0 /100 | #342 | Tragic 18.4% |
| Navajo | 0.0 /100 | #343 | Tragic 18.6% |
| Crow | 0.0 /100 | #344 | Tragic 20.1% |
| Hopi | 0.0 /100 | #345 | Tragic 21.5% |
| Inupiat | 0.0 /100 | #346 | Tragic 22.0% |
| Yup'ik | 0.0 /100 | #347 | Tragic 23.7% |