Irish vs Korean Unemployment Among Seniors over 65 years

COMPARE

Irish
Race
Ancestry
AfghanAfricanAlaska NativeAlaskan AthabascanAlbanianAleutAlsatianAmericanApacheArabArapahoArgentineanArmenianAssyrian/Chaldean/SyriacAustralianAustrianBahamianBangladeshiBarbadianBasqueBelgianBelizeanBermudanBhutaneseBlackfeetBolivianBrazilianBritishBritish West IndianBulgarianBurmeseCajunCambodianCanadianCape VerdeanCarpatho RusynCelticCentral AmericanCentral American IndianCherokeeCheyenneChickasawChileanChineseChippewaChoctawColombianColvilleComancheCosta RicanCreeCreekCroatianCrowCubanCypriotCzechCzechoslovakianDanishDelawareDominicanDutchDutch West IndianEastern EuropeanEcuadorianEgyptianEnglishEstonianEthiopianEuropeanFijianFilipinoFinnishFrenchFrench American IndianFrench CanadianGermanGerman RussianGhanaianGreekGuamanian/ChamorroGuatemalanGuyaneseHaitianHmongHonduranHopiHoumaHungarianIcelanderIndian (Asian)IndonesianInupiatIranianIraqiIrishIroquoisIsraeliItalianJamaicanJapaneseJordanianKenyanKiowaLaotianLatvianLebaneseLiberianLithuanianLumbeeLuxembourgerMacedonianMalaysianMalteseMarshalleseMenomineeMexicanMexican American IndianMongolianMoroccanNative HawaiianNavajoNepaleseNew ZealanderNicaraguanNigerianNorthern EuropeanNorwegianOkinawanOsageOttawaPaiutePakistaniPalestinianPanamanianParaguayanPennsylvania GermanPeruvianPimaPolishPortuguesePotawatomiPuebloPuerto RicanPuget Sound SalishRomanianRussianSalvadoranSamoanScandinavianScotch-IrishScottishSeminoleSenegaleseSerbianShoshoneSierra LeoneanSiouxSlavicSlovakSloveneSomaliSouth AfricanSouth AmericanSouth American IndianSoviet UnionSpaniardSpanishSpanish AmericanSpanish American IndianSri LankanSubsaharan AfricanSudaneseSwedishSwissSyrianTaiwaneseThaiTlingit-HaidaTohono O'OdhamTonganTrinidadian and TobagonianTsimshianTurkishU.S. Virgin IslanderUgandanUkrainianUruguayanUteVenezuelanVietnameseWelshWest IndianYakamaYaquiYugoslavianYumanYup'ikZimbabwean
Immigration
NonimmigrantsImmigrantsAfghanistanAfricaAlbaniaArgentinaArmeniaAsiaAustraliaAustriaBahamasBangladeshBarbadosBelarusBelgiumBelizeBoliviaBosnia and HerzegovinaBrazilBulgariaBurma/MyanmarCabo VerdeCambodiaCameroonCanadaCaribbeanCentral AmericaChileChinaColombiaCongoCosta RicaCroatiaCubaCzechoslovakiaDenmarkDominicaDominican RepublicEastern AfricaEastern AsiaEastern EuropeEcuadorEgyptEl SalvadorEnglandEritreaEthiopiaEuropeFijiFranceGermanyGhanaGreeceGrenadaGuatemalaGuyanaHaitiHondurasHong KongHungaryIndiaIndonesiaIranIraqIrelandIsraelItalyJamaicaJapanJordanKazakhstanKenyaKoreaKuwaitLaosLatin AmericaLatviaLebanonLiberiaLithuaniaMalaysiaMexicoMicronesiaMiddle AfricaMoldovaMoroccoNepalNetherlandsNicaraguaNigeriaNorth AmericaNorth MacedoniaNorthern AfricaNorthern EuropeNorwayOceaniaPakistanPanamaPeruPhilippinesPolandPortugalRomaniaRussiaSaudi ArabiaScotlandSenegalSerbiaSierra LeoneSingaporeSomaliaSouth AfricaSouth AmericaSouth Central AsiaSouth Eastern AsiaSouthern EuropeSpainSri LankaSt. Vincent and the GrenadinesSudanSwedenSwitzerlandSyriaTaiwanThailandTrinidad and TobagoTurkeyUgandaUkraineUruguayUzbekistanVenezuelaVietnamWest IndiesWestern AfricaWestern AsiaWestern EuropeYemenZaireZimbabweAzores
Korean
Race
Ancestry
AfghanAfricanAlaska NativeAlaskan AthabascanAlbanianAleutAlsatianAmericanApacheArabArapahoArgentineanArmenianAssyrian/Chaldean/SyriacAustralianAustrianBahamianBangladeshiBarbadianBasqueBelgianBelizeanBermudanBhutaneseBlackfeetBolivianBrazilianBritishBritish West IndianBulgarianBurmeseCajunCambodianCanadianCape VerdeanCarpatho RusynCelticCentral AmericanCentral American IndianCherokeeCheyenneChickasawChileanChineseChippewaChoctawColombianColvilleComancheCosta RicanCreeCreekCroatianCrowCubanCypriotCzechCzechoslovakianDanishDelawareDominicanDutchDutch West IndianEastern EuropeanEcuadorianEgyptianEnglishEstonianEthiopianEuropeanFijianFilipinoFinnishFrenchFrench American IndianFrench CanadianGermanGerman RussianGhanaianGreekGuamanian/ChamorroGuatemalanGuyaneseHaitianHmongHonduranHopiHoumaHungarianIcelanderIndian (Asian)IndonesianInupiatIranianIraqiIroquoisIsraeliItalianJamaicanJapaneseJordanianKenyanKiowaKoreanLaotianLatvianLebaneseLiberianLithuanianLumbeeLuxembourgerMacedonianMalaysianMalteseMarshalleseMenomineeMexicanMexican American IndianMongolianMoroccanNative HawaiianNavajoNepaleseNew ZealanderNicaraguanNigerianNorthern EuropeanNorwegianOkinawanOsageOttawaPaiutePakistaniPalestinianPanamanianParaguayanPennsylvania GermanPeruvianPimaPolishPortuguesePotawatomiPuebloPuerto RicanPuget Sound SalishRomanianRussianSalvadoranSamoanScandinavianScotch-IrishScottishSeminoleSenegaleseSerbianShoshoneSierra LeoneanSiouxSlavicSlovakSloveneSomaliSouth AfricanSouth AmericanSouth American IndianSoviet UnionSpaniardSpanishSpanish AmericanSpanish American IndianSri LankanSubsaharan AfricanSudaneseSwedishSwissSyrianTaiwaneseThaiTlingit-HaidaTohono O'OdhamTonganTrinidadian and TobagonianTsimshianTurkishU.S. Virgin IslanderUgandanUkrainianUruguayanUteVenezuelanVietnameseWelshWest IndianYakamaYaquiYugoslavianYumanYup'ikZimbabwean
Immigration
NonimmigrantsImmigrantsAfghanistanAfricaAlbaniaArgentinaArmeniaAsiaAustraliaAustriaBahamasBangladeshBarbadosBelarusBelgiumBelizeBoliviaBosnia and HerzegovinaBrazilBulgariaBurma/MyanmarCabo VerdeCambodiaCameroonCanadaCaribbeanCentral AmericaChileChinaColombiaCongoCosta RicaCroatiaCubaCzechoslovakiaDenmarkDominicaDominican RepublicEastern AfricaEastern AsiaEastern EuropeEcuadorEgyptEl SalvadorEnglandEritreaEthiopiaEuropeFijiFranceGermanyGhanaGreeceGrenadaGuatemalaGuyanaHaitiHondurasHong KongHungaryIndiaIndonesiaIranIraqIrelandIsraelItalyJamaicaJapanJordanKazakhstanKenyaKoreaKuwaitLaosLatin AmericaLatviaLebanonLiberiaLithuaniaMalaysiaMexicoMicronesiaMiddle AfricaMoldovaMoroccoNepalNetherlandsNicaraguaNigeriaNorth AmericaNorth MacedoniaNorthern AfricaNorthern EuropeNorwayOceaniaPakistanPanamaPeruPhilippinesPolandPortugalRomaniaRussiaSaudi ArabiaScotlandSenegalSerbiaSierra LeoneSingaporeSomaliaSouth AfricaSouth AmericaSouth Central AsiaSouth Eastern AsiaSouthern EuropeSpainSri LankaSt. Vincent and the GrenadinesSudanSwedenSwitzerlandSyriaTaiwanThailandTrinidad and TobagoTurkeyUgandaUkraineUruguayUzbekistanVenezuelaVietnamWest IndiesWestern AfricaWestern AsiaWestern EuropeYemenZaireZimbabweAzores
Unemployment Among Seniors over 65 years
Income
Poverty
Unemployment
Labor Participation
Family Structure
Vehicle Availability
Education Level
Disability

Unemployment Among Seniors over 65 years Comparison

Irish

Koreans

Excellent
Fair
5.1%
UNEMPLOYMENT AMONG SENIORS OVER 65 YEARS
88.8/ 100
METRIC RATING
120th/ 347
METRIC RANK
5.2%
UNEMPLOYMENT AMONG SENIORS OVER 65 YEARS
31.6/ 100
METRIC RATING
190th/ 347
METRIC RANK

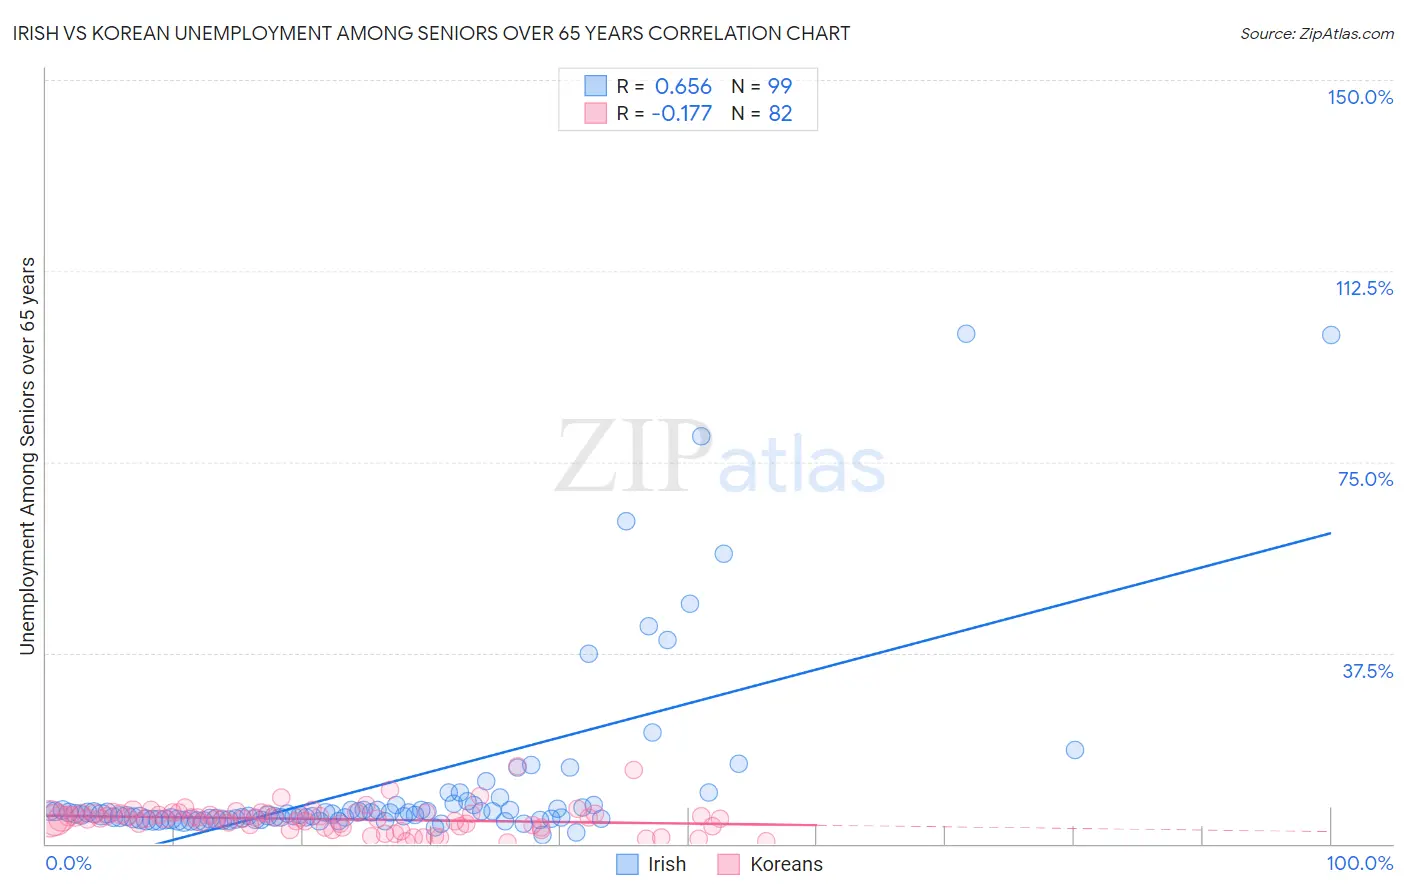
Irish vs Korean Unemployment Among Seniors over 65 years Correlation Chart

The statistical analysis conducted on geographies consisting of 463,850,223 people shows a significant positive correlation between the proportion of Irish and unemployment rate amomg seniors over the age of 65 in the United States with a correlation coefficient (R) of 0.656 and weighted average of 5.1%. Similarly, the statistical analysis conducted on geographies consisting of 437,363,270 people shows a poor negative correlation between the proportion of Koreans and unemployment rate amomg seniors over the age of 65 in the United States with a correlation coefficient (R) of -0.177 and weighted average of 5.2%, a difference of 2.3%.
Irish vs Korean Unemployment Among Seniors over 65 years

Unemployment Among Seniors over 65 years Correlation Summary

MeasurementIrishKorean
Minimum1.8%0.20%
Maximum100.1%15.2%
Range98.3%15.0%
Mean11.6%4.8%
Median5.8%5.0%
Interquartile 25% (IQ1)4.8%3.4%
Interquartile 75% (IQ3)7.6%6.0%
Interquartile Range (IQR)2.7%2.6%
Standard Deviation (Sample)18.1%2.6%
Standard Deviation (Population)18.0%2.6%

Similar Demographics by Unemployment Among Seniors over 65 years

Demographics Similar to Irish by Unemployment Among Seniors over 65 years

In terms of unemployment among seniors over 65 years, the demographic groups most similar to Irish are Puget Sound Salish (5.1%, a difference of 0.010%), Immigrants from Cameroon (5.1%, a difference of 0.020%), Asian (5.1%, a difference of 0.020%), Immigrants from North America (5.1%, a difference of 0.070%), and Immigrants from Canada (5.1%, a difference of 0.080%).
DemographicsRating | RankUnemployment Among Seniors over 65 years
Seminole
91.4
/100
|
#113
Exceptional
5.0%
Immigrants | Latvia
91.4
/100
|
#114
Exceptional
5.0%
Celtics
91.3
/100
|
#115
Exceptional
5.0%
Immigrants | Korea
91.0
/100
|
#116
Exceptional
5.0%
Malaysians
90.4
/100
|
#117
Exceptional
5.1%
Soviet Union
90.1
/100
|
#118
Exceptional
5.1%
Immigrants | Canada
89.7
/100
|
#119
Excellent
5.1%
Irish
88.8
/100
|
#120
Excellent
5.1%
Puget Sound Salish
88.7
/100
|
#121
Excellent
5.1%
Immigrants | Cameroon
88.6
/100
|
#122
Excellent
5.1%
Asians
88.5
/100
|
#123
Excellent
5.1%
Immigrants | North America
87.9
/100
|
#124
Excellent
5.1%
Dutch
87.6
/100
|
#125
Excellent
5.1%
Immigrants | Sri Lanka
87.4
/100
|
#126
Excellent
5.1%
Sri Lankans
87.4
/100
|
#127
Excellent
5.1%

Demographics Similar to Koreans by Unemployment Among Seniors over 65 years

In terms of unemployment among seniors over 65 years, the demographic groups most similar to Koreans are Immigrants from Denmark (5.2%, a difference of 0.020%), Bangladeshi (5.2%, a difference of 0.030%), Sioux (5.2%, a difference of 0.030%), Immigrants from Egypt (5.2%, a difference of 0.060%), and Somali (5.2%, a difference of 0.070%).
DemographicsRating | RankUnemployment Among Seniors over 65 years
Immigrants | Western Asia
42.1
/100
|
#183
Average
5.2%
Immigrants | Serbia
41.6
/100
|
#184
Average
5.2%
Immigrants | Iran
36.0
/100
|
#185
Fair
5.2%
Americans
35.1
/100
|
#186
Fair
5.2%
Somalis
33.5
/100
|
#187
Fair
5.2%
Immigrants | Egypt
33.2
/100
|
#188
Fair
5.2%
Bangladeshis
32.3
/100
|
#189
Fair
5.2%
Koreans
31.6
/100
|
#190
Fair
5.2%
Immigrants | Denmark
31.0
/100
|
#191
Fair
5.2%
Sioux
30.8
/100
|
#192
Fair
5.2%
Immigrants | Africa
29.6
/100
|
#193
Fair
5.2%
Argentineans
29.1
/100
|
#194
Fair
5.2%
Costa Ricans
27.0
/100
|
#195
Fair
5.2%
Immigrants | Poland
24.3
/100
|
#196
Fair
5.2%
Guamanians/Chamorros
22.5
/100
|
#197
Fair
5.2%