Irish vs Carpatho Rusyn Unemployment
COMPARE
Irish
Carpatho Rusyn
Unemployment
Unemployment Comparison
Irish
Carpatho Rusyns
4.8%
UNEMPLOYMENT
99.8/ 100
METRIC RATING
30th/ 347
METRIC RANK
4.7%
UNEMPLOYMENT
99.9/ 100
METRIC RATING
20th/ 347
METRIC RANK
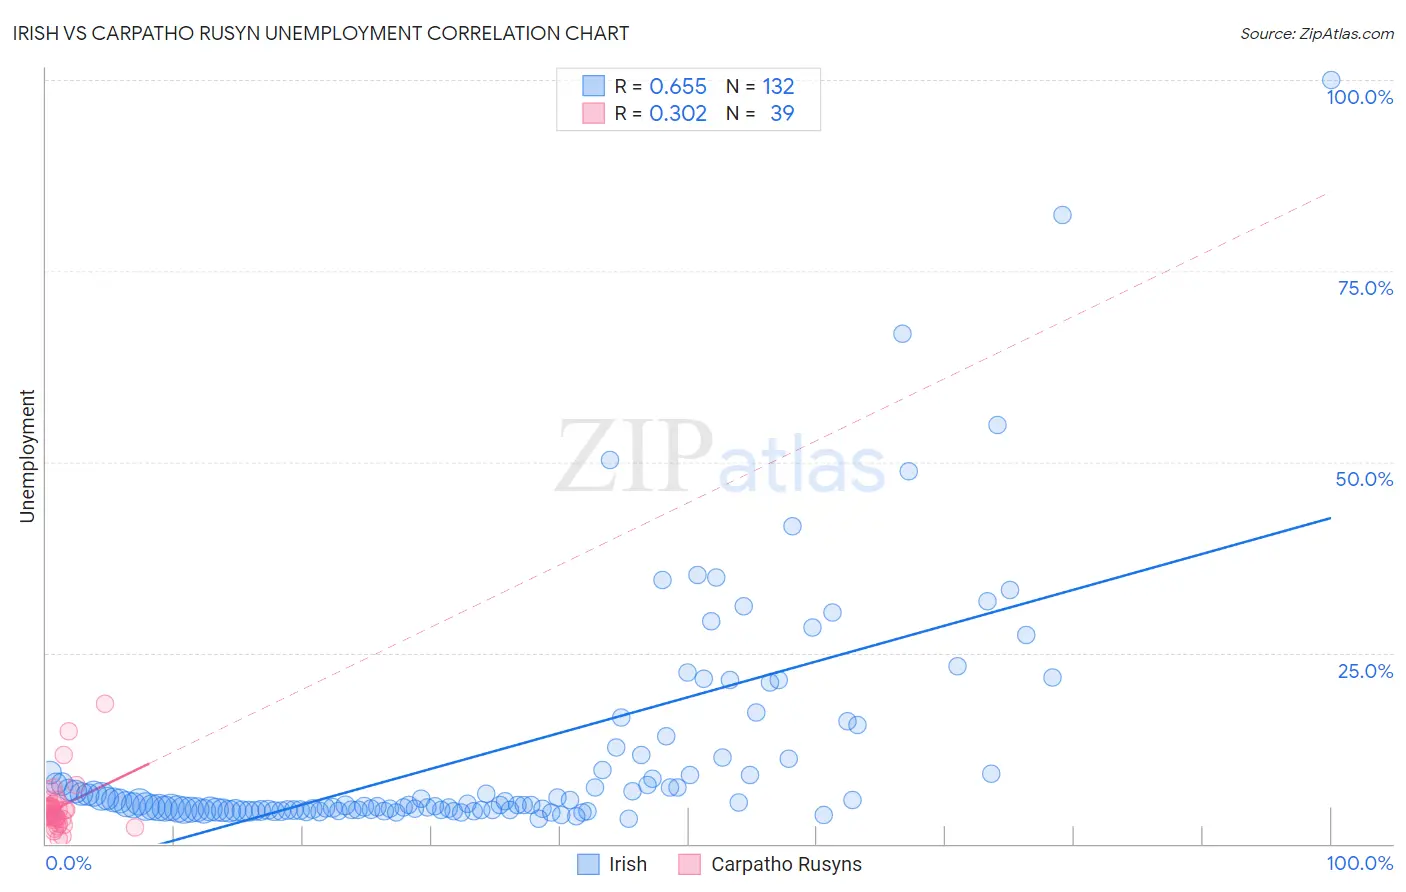
Irish vs Carpatho Rusyn Unemployment Correlation Chart
The statistical analysis conducted on geographies consisting of 574,923,792 people shows a significant positive correlation between the proportion of Irish and unemployment in the United States with a correlation coefficient (R) of 0.655 and weighted average of 4.8%. Similarly, the statistical analysis conducted on geographies consisting of 58,844,361 people shows a mild positive correlation between the proportion of Carpatho Rusyns and unemployment in the United States with a correlation coefficient (R) of 0.302 and weighted average of 4.7%, a difference of 1.4%.
Unemployment Correlation Summary
| Measurement | Irish | Carpatho Rusyn |
| Minimum | 3.3% | 0.70% |
| Maximum | 100.0% | 18.3% |
| Range | 96.7% | 17.6% |
| Mean | 11.8% | 4.8% |
| Median | 5.1% | 4.4% |
| Interquartile 25% (IQ1) | 4.5% | 3.3% |
| Interquartile 75% (IQ3) | 10.3% | 4.9% |
| Interquartile Range (IQR) | 5.9% | 1.6% |
| Standard Deviation (Sample) | 15.3% | 3.4% |
| Standard Deviation (Population) | 15.2% | 3.4% |
Demographics Similar to Irish and Carpatho Rusyns by Unemployment
In terms of unemployment, the demographic groups most similar to Irish are Croatian (4.8%, a difference of 0.020%), Zimbabwean (4.8%, a difference of 0.12%), Sudanese (4.8%, a difference of 0.13%), Immigrants from Bolivia (4.8%, a difference of 0.17%), and Polish (4.7%, a difference of 0.24%). Similarly, the demographic groups most similar to Carpatho Rusyns are Welsh (4.7%, a difference of 0.020%), Thai (4.7%, a difference of 0.020%), British (4.7%, a difference of 0.32%), Venezuelan (4.7%, a difference of 0.40%), and Latvian (4.7%, a difference of 0.47%).
| Demographics | Rating | Rank | Unemployment |
| Europeans | 99.9 /100 | #15 | Exceptional 4.6% |
| Chinese | 99.9 /100 | #16 | Exceptional 4.7% |
| Slovenes | 99.9 /100 | #17 | Exceptional 4.7% |
| Immigrants | Venezuela | 99.9 /100 | #18 | Exceptional 4.7% |
| Scottish | 99.9 /100 | #19 | Exceptional 4.7% |
| Carpatho Rusyns | 99.9 /100 | #20 | Exceptional 4.7% |
| Welsh | 99.9 /100 | #21 | Exceptional 4.7% |
| Thais | 99.9 /100 | #22 | Exceptional 4.7% |
| British | 99.9 /100 | #23 | Exceptional 4.7% |
| Venezuelans | 99.9 /100 | #24 | Exceptional 4.7% |
| Latvians | 99.9 /100 | #25 | Exceptional 4.7% |
| Bulgarians | 99.9 /100 | #26 | Exceptional 4.7% |
| Finns | 99.9 /100 | #27 | Exceptional 4.7% |
| Cubans | 99.8 /100 | #28 | Exceptional 4.7% |
| Poles | 99.8 /100 | #29 | Exceptional 4.7% |
| Irish | 99.8 /100 | #30 | Exceptional 4.8% |
| Croatians | 99.8 /100 | #31 | Exceptional 4.8% |
| Zimbabweans | 99.8 /100 | #32 | Exceptional 4.8% |
| Sudanese | 99.8 /100 | #33 | Exceptional 4.8% |
| Immigrants | Bolivia | 99.8 /100 | #34 | Exceptional 4.8% |
| Scotch-Irish | 99.8 /100 | #35 | Exceptional 4.8% |