Iraqi vs Immigrants from Mexico Male Unemployment
COMPARE
Iraqi
Immigrants from Mexico
Male Unemployment
Male Unemployment Comparison
Iraqis
Immigrants from Mexico
5.4%
MALE UNEMPLOYMENT
31.6/ 100
METRIC RATING
186th/ 347
METRIC RANK
5.9%
MALE UNEMPLOYMENT
0.0/ 100
METRIC RATING
264th/ 347
METRIC RANK
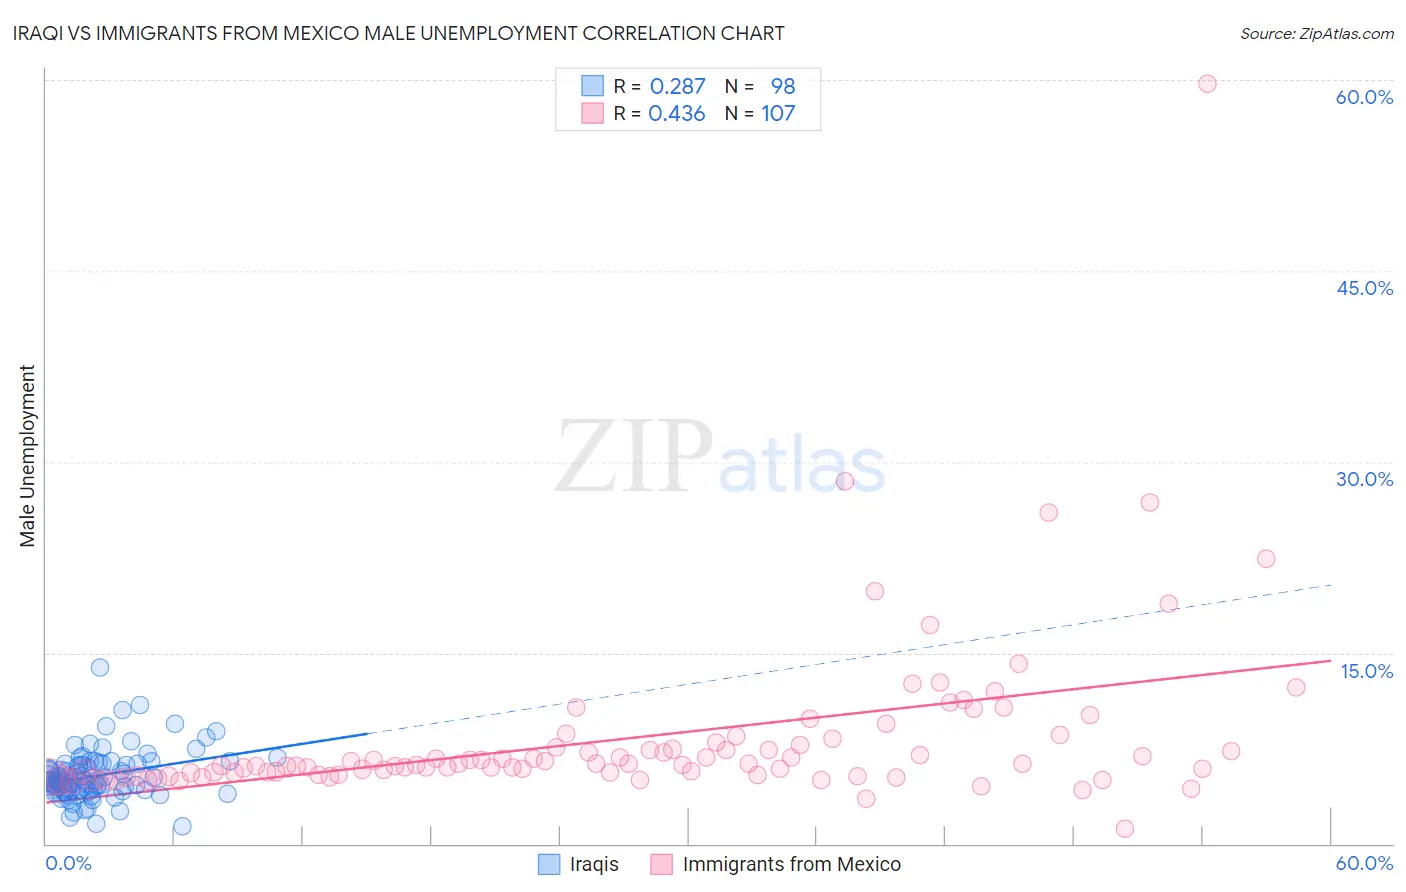
Iraqi vs Immigrants from Mexico Male Unemployment Correlation Chart
The statistical analysis conducted on geographies consisting of 170,532,331 people shows a weak positive correlation between the proportion of Iraqis and unemployment rate among males in the United States with a correlation coefficient (R) of 0.287 and weighted average of 5.4%. Similarly, the statistical analysis conducted on geographies consisting of 508,075,361 people shows a moderate positive correlation between the proportion of Immigrants from Mexico and unemployment rate among males in the United States with a correlation coefficient (R) of 0.436 and weighted average of 5.9%, a difference of 9.9%.
Male Unemployment Correlation Summary
| Measurement | Iraqi | Immigrants from Mexico |
| Minimum | 1.4% | 1.2% |
| Maximum | 13.8% | 59.7% |
| Range | 12.4% | 58.5% |
| Mean | 5.4% | 8.3% |
| Median | 4.9% | 6.2% |
| Interquartile 25% (IQ1) | 4.2% | 5.4% |
| Interquartile 75% (IQ3) | 6.3% | 7.8% |
| Interquartile Range (IQR) | 2.1% | 2.4% |
| Standard Deviation (Sample) | 1.9% | 6.8% |
| Standard Deviation (Population) | 1.9% | 6.8% |
Similar Demographics by Male Unemployment
Demographics Similar to Iraqis by Male Unemployment
In terms of male unemployment, the demographic groups most similar to Iraqis are Costa Rican (5.4%, a difference of 0.010%), Arab (5.4%, a difference of 0.090%), Immigrants from South America (5.4%, a difference of 0.15%), Immigrants from Uganda (5.4%, a difference of 0.19%), and Korean (5.3%, a difference of 0.22%).
| Demographics | Rating | Rank | Male Unemployment |
| Immigrants | Oceania | 40.8 /100 | #179 | Average 5.3% |
| Malaysians | 39.6 /100 | #180 | Fair 5.3% |
| Immigrants | Afghanistan | 37.9 /100 | #181 | Fair 5.3% |
| Potawatomi | 37.8 /100 | #182 | Fair 5.3% |
| Taiwanese | 37.6 /100 | #183 | Fair 5.3% |
| Spaniards | 35.1 /100 | #184 | Fair 5.3% |
| Koreans | 34.9 /100 | #185 | Fair 5.3% |
| Iraqis | 31.6 /100 | #186 | Fair 5.4% |
| Costa Ricans | 31.3 /100 | #187 | Fair 5.4% |
| Arabs | 30.2 /100 | #188 | Fair 5.4% |
| Immigrants | South America | 29.4 /100 | #189 | Fair 5.4% |
| Immigrants | Uganda | 28.8 /100 | #190 | Fair 5.4% |
| Immigrants | South Eastern Asia | 28.2 /100 | #191 | Fair 5.4% |
| Immigrants | Belarus | 26.0 /100 | #192 | Fair 5.4% |
| Immigrants | Israel | 25.2 /100 | #193 | Fair 5.4% |
Demographics Similar to Immigrants from Mexico by Male Unemployment
In terms of male unemployment, the demographic groups most similar to Immigrants from Mexico are Immigrants from Latin America (5.9%, a difference of 0.22%), French American Indian (5.9%, a difference of 0.39%), Immigrants from Portugal (5.9%, a difference of 0.46%), Bahamian (5.9%, a difference of 0.52%), and Nigerian (5.9%, a difference of 0.65%).
| Demographics | Rating | Rank | Male Unemployment |
| Hispanics or Latinos | 0.1 /100 | #257 | Tragic 5.8% |
| Dutch West Indians | 0.1 /100 | #258 | Tragic 5.8% |
| Cajuns | 0.1 /100 | #259 | Tragic 5.8% |
| Immigrants | Central America | 0.1 /100 | #260 | Tragic 5.8% |
| Liberians | 0.1 /100 | #261 | Tragic 5.8% |
| Immigrants | Portugal | 0.1 /100 | #262 | Tragic 5.9% |
| Immigrants | Latin America | 0.1 /100 | #263 | Tragic 5.9% |
| Immigrants | Mexico | 0.0 /100 | #264 | Tragic 5.9% |
| French American Indians | 0.0 /100 | #265 | Tragic 5.9% |
| Bahamians | 0.0 /100 | #266 | Tragic 5.9% |
| Nigerians | 0.0 /100 | #267 | Tragic 5.9% |
| Bermudans | 0.0 /100 | #268 | Tragic 5.9% |
| Immigrants | Nigeria | 0.0 /100 | #269 | Tragic 6.0% |
| Sub-Saharan Africans | 0.0 /100 | #270 | Tragic 6.0% |
| Blackfeet | 0.0 /100 | #271 | Tragic 6.0% |