Iranian vs Immigrants from Cameroon Female Unemployment
COMPARE
Iranian
Immigrants from Cameroon
Female Unemployment
Female Unemployment Comparison
Iranians
Immigrants from Cameroon
5.3%
FEMALE UNEMPLOYMENT
50.4/ 100
METRIC RATING
173rd/ 347
METRIC RANK
5.7%
FEMALE UNEMPLOYMENT
0.6/ 100
METRIC RATING
255th/ 347
METRIC RANK
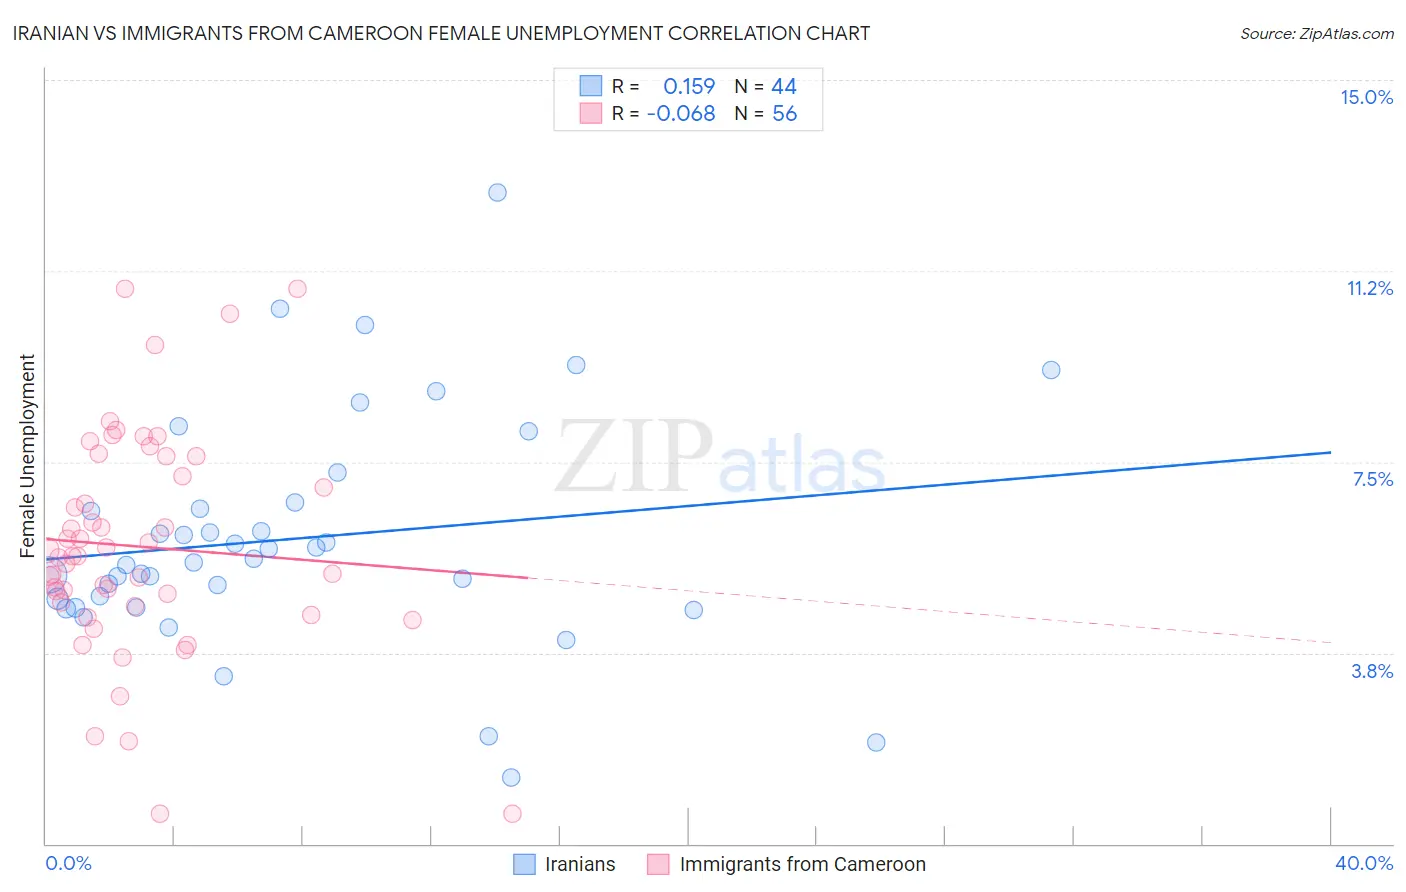
Iranian vs Immigrants from Cameroon Female Unemployment Correlation Chart
The statistical analysis conducted on geographies consisting of 316,106,096 people shows a poor positive correlation between the proportion of Iranians and unemploymnet rate among females in the United States with a correlation coefficient (R) of 0.159 and weighted average of 5.3%. Similarly, the statistical analysis conducted on geographies consisting of 130,670,157 people shows a slight negative correlation between the proportion of Immigrants from Cameroon and unemploymnet rate among females in the United States with a correlation coefficient (R) of -0.068 and weighted average of 5.7%, a difference of 7.7%.
Female Unemployment Correlation Summary
| Measurement | Iranian | Immigrants from Cameroon |
| Minimum | 1.3% | 0.60% |
| Maximum | 12.8% | 10.9% |
| Range | 11.5% | 10.3% |
| Mean | 6.0% | 5.8% |
| Median | 5.6% | 5.6% |
| Interquartile 25% (IQ1) | 4.7% | 4.7% |
| Interquartile 75% (IQ3) | 6.6% | 7.4% |
| Interquartile Range (IQR) | 1.9% | 2.7% |
| Standard Deviation (Sample) | 2.3% | 2.2% |
| Standard Deviation (Population) | 2.2% | 2.2% |
Similar Demographics by Female Unemployment
Demographics Similar to Iranians by Female Unemployment
In terms of female unemployment, the demographic groups most similar to Iranians are Immigrants from Uganda (5.3%, a difference of 0.020%), Immigrants from Poland (5.3%, a difference of 0.020%), Immigrants from Laos (5.3%, a difference of 0.17%), Immigrants from Vietnam (5.3%, a difference of 0.18%), and Immigrants from Morocco (5.3%, a difference of 0.18%).
| Demographics | Rating | Rank | Female Unemployment |
| Native Hawaiians | 62.7 /100 | #166 | Good 5.2% |
| Immigrants | Thailand | 62.1 /100 | #167 | Good 5.2% |
| Sri Lankans | 59.4 /100 | #168 | Average 5.2% |
| Immigrants | Chile | 59.0 /100 | #169 | Average 5.2% |
| Spanish | 55.9 /100 | #170 | Average 5.2% |
| Immigrants | Denmark | 55.0 /100 | #171 | Average 5.2% |
| Immigrants | Uganda | 50.7 /100 | #172 | Average 5.3% |
| Iranians | 50.4 /100 | #173 | Average 5.3% |
| Immigrants | Poland | 50.0 /100 | #174 | Average 5.3% |
| Immigrants | Laos | 47.5 /100 | #175 | Average 5.3% |
| Immigrants | Vietnam | 47.5 /100 | #176 | Average 5.3% |
| Immigrants | Morocco | 47.4 /100 | #177 | Average 5.3% |
| Immigrants | Southern Europe | 46.2 /100 | #178 | Average 5.3% |
| Laotians | 45.1 /100 | #179 | Average 5.3% |
| Immigrants | Congo | 43.1 /100 | #180 | Average 5.3% |
Demographics Similar to Immigrants from Cameroon by Female Unemployment
In terms of female unemployment, the demographic groups most similar to Immigrants from Cameroon are Immigrants from Sierra Leone (5.7%, a difference of 0.040%), Immigrants (5.7%, a difference of 0.040%), Cajun (5.7%, a difference of 0.18%), Assyrian/Chaldean/Syriac (5.6%, a difference of 0.38%), and Immigrants from Syria (5.6%, a difference of 0.44%).
| Demographics | Rating | Rank | Female Unemployment |
| Cree | 1.0 /100 | #248 | Tragic 5.6% |
| Immigrants | Uzbekistan | 1.0 /100 | #249 | Tragic 5.6% |
| Immigrants | Syria | 0.8 /100 | #250 | Tragic 5.6% |
| Assyrians/Chaldeans/Syriacs | 0.8 /100 | #251 | Tragic 5.6% |
| Cajuns | 0.7 /100 | #252 | Tragic 5.7% |
| Immigrants | Sierra Leone | 0.6 /100 | #253 | Tragic 5.7% |
| Immigrants | Immigrants | 0.6 /100 | #254 | Tragic 5.7% |
| Immigrants | Cameroon | 0.6 /100 | #255 | Tragic 5.7% |
| Sub-Saharan Africans | 0.4 /100 | #256 | Tragic 5.7% |
| Dutch West Indians | 0.3 /100 | #257 | Tragic 5.7% |
| Immigrants | Portugal | 0.2 /100 | #258 | Tragic 5.8% |
| Immigrants | Fiji | 0.2 /100 | #259 | Tragic 5.8% |
| Nigerians | 0.2 /100 | #260 | Tragic 5.8% |
| Kiowa | 0.1 /100 | #261 | Tragic 5.8% |
| Immigrants | Nigeria | 0.1 /100 | #262 | Tragic 5.8% |