Iranian vs Guamanian/Chamorro Male Unemployment
COMPARE
Iranian
Guamanian/Chamorro
Male Unemployment
Male Unemployment Comparison
Iranians
Guamanians/Chamorros
5.0%
MALE UNEMPLOYMENT
96.4/ 100
METRIC RATING
77th/ 347
METRIC RANK
5.4%
MALE UNEMPLOYMENT
12.3/ 100
METRIC RATING
204th/ 347
METRIC RANK
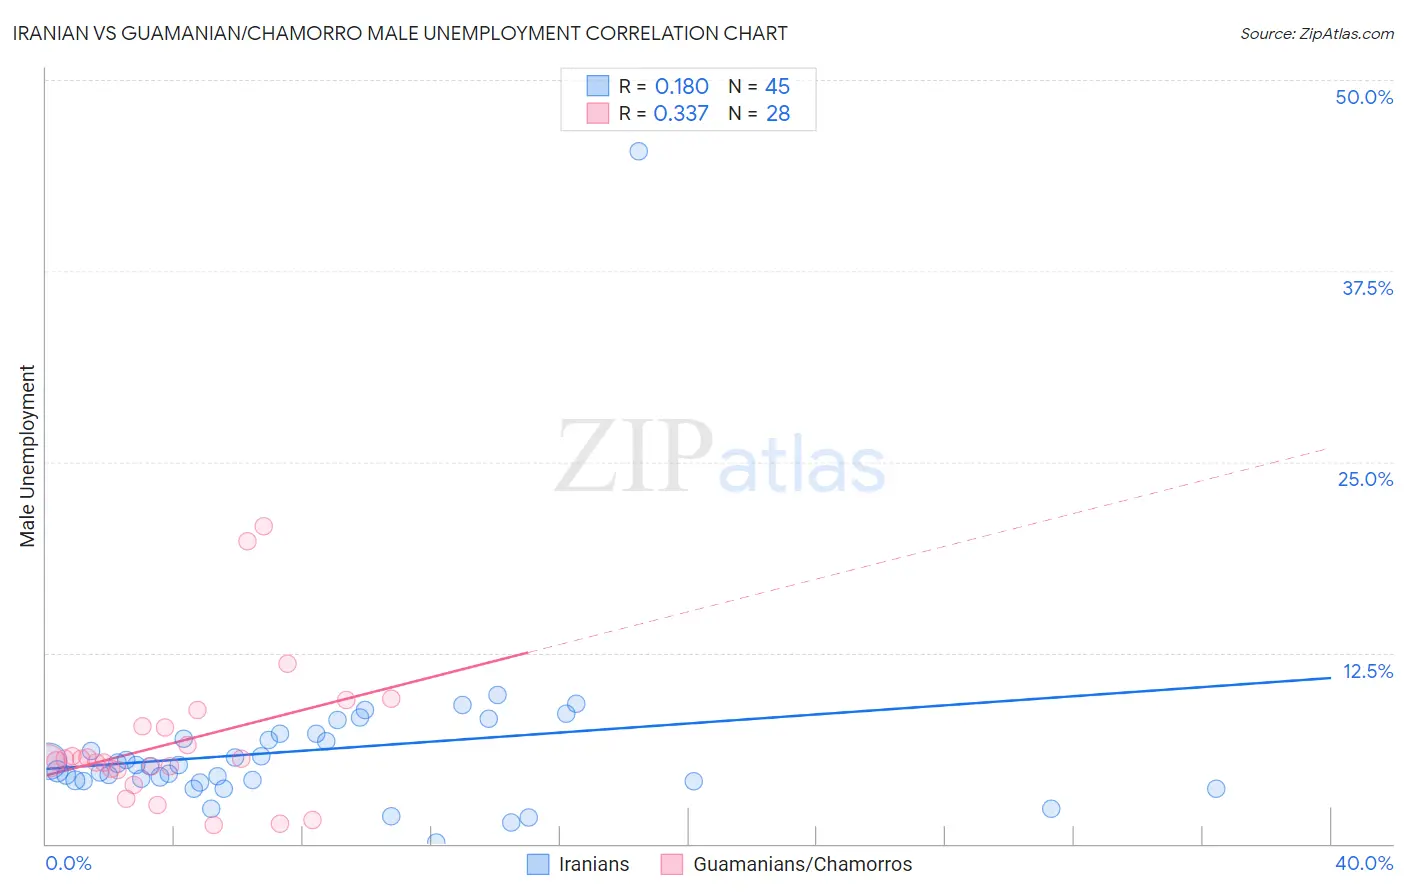
Iranian vs Guamanian/Chamorro Male Unemployment Correlation Chart
The statistical analysis conducted on geographies consisting of 316,157,253 people shows a poor positive correlation between the proportion of Iranians and unemployment rate among males in the United States with a correlation coefficient (R) of 0.180 and weighted average of 5.0%. Similarly, the statistical analysis conducted on geographies consisting of 221,364,428 people shows a mild positive correlation between the proportion of Guamanians/Chamorros and unemployment rate among males in the United States with a correlation coefficient (R) of 0.337 and weighted average of 5.4%, a difference of 8.1%.
Male Unemployment Correlation Summary
| Measurement | Iranian | Guamanian/Chamorro |
| Minimum | 0.10% | 1.2% |
| Maximum | 45.3% | 20.8% |
| Range | 45.2% | 19.6% |
| Mean | 6.1% | 6.6% |
| Median | 5.1% | 5.5% |
| Interquartile 25% (IQ1) | 4.1% | 4.9% |
| Interquartile 75% (IQ3) | 7.0% | 7.7% |
| Interquartile Range (IQR) | 2.9% | 2.8% |
| Standard Deviation (Sample) | 6.4% | 4.6% |
| Standard Deviation (Population) | 6.3% | 4.5% |
Similar Demographics by Male Unemployment
Demographics Similar to Iranians by Male Unemployment
In terms of male unemployment, the demographic groups most similar to Iranians are Immigrants from Northern Europe (5.0%, a difference of 0.010%), South African (5.0%, a difference of 0.020%), Immigrants from Sudan (5.0%, a difference of 0.050%), Argentinean (5.0%, a difference of 0.080%), and French (5.0%, a difference of 0.080%).
| Demographics | Rating | Rank | Male Unemployment |
| Whites/Caucasians | 97.3 /100 | #70 | Exceptional 5.0% |
| New Zealanders | 97.3 /100 | #71 | Exceptional 5.0% |
| Immigrants | South Africa | 97.1 /100 | #72 | Exceptional 5.0% |
| Greeks | 97.0 /100 | #73 | Exceptional 5.0% |
| Immigrants | North America | 96.9 /100 | #74 | Exceptional 5.0% |
| Assyrians/Chaldeans/Syriacs | 96.9 /100 | #75 | Exceptional 5.0% |
| Immigrants | Sudan | 96.5 /100 | #76 | Exceptional 5.0% |
| Iranians | 96.4 /100 | #77 | Exceptional 5.0% |
| Immigrants | Northern Europe | 96.4 /100 | #78 | Exceptional 5.0% |
| South Africans | 96.4 /100 | #79 | Exceptional 5.0% |
| Argentineans | 96.2 /100 | #80 | Exceptional 5.0% |
| French | 96.2 /100 | #81 | Exceptional 5.0% |
| Chileans | 96.2 /100 | #82 | Exceptional 5.0% |
| Immigrants | Eritrea | 96.0 /100 | #83 | Exceptional 5.0% |
| Serbians | 95.7 /100 | #84 | Exceptional 5.1% |
Demographics Similar to Guamanians/Chamorros by Male Unemployment
In terms of male unemployment, the demographic groups most similar to Guamanians/Chamorros are Immigrants from Laos (5.4%, a difference of 0.090%), Nonimmigrants (5.4%, a difference of 0.10%), Immigrants from Costa Rica (5.5%, a difference of 0.13%), Immigrants from Philippines (5.4%, a difference of 0.15%), and Immigrants from Zaire (5.4%, a difference of 0.17%).
| Demographics | Rating | Rank | Male Unemployment |
| Alsatians | 16.7 /100 | #197 | Poor 5.4% |
| Immigrants | Thailand | 14.7 /100 | #198 | Poor 5.4% |
| Immigrants | Greece | 14.5 /100 | #199 | Poor 5.4% |
| Immigrants | Zaire | 13.7 /100 | #200 | Poor 5.4% |
| Immigrants | Philippines | 13.5 /100 | #201 | Poor 5.4% |
| Immigrants | Nonimmigrants | 13.1 /100 | #202 | Poor 5.4% |
| Immigrants | Laos | 13.0 /100 | #203 | Poor 5.4% |
| Guamanians/Chamorros | 12.3 /100 | #204 | Poor 5.4% |
| Immigrants | Costa Rica | 11.4 /100 | #205 | Poor 5.5% |
| Immigrants | Ukraine | 9.9 /100 | #206 | Tragic 5.5% |
| Immigrants | Syria | 9.3 /100 | #207 | Tragic 5.5% |
| Immigrants | Lebanon | 8.6 /100 | #208 | Tragic 5.5% |
| Immigrants | Middle Africa | 8.3 /100 | #209 | Tragic 5.5% |
| South American Indians | 7.6 /100 | #210 | Tragic 5.5% |
| Israelis | 7.4 /100 | #211 | Tragic 5.5% |