Iranian vs Bermudan Unemployment
COMPARE
Iranian
Bermudan
Unemployment
Unemployment Comparison
Iranians
Bermudans
5.1%
UNEMPLOYMENT
86.9/ 100
METRIC RATING
130th/ 347
METRIC RANK
5.6%
UNEMPLOYMENT
1.1/ 100
METRIC RATING
246th/ 347
METRIC RANK
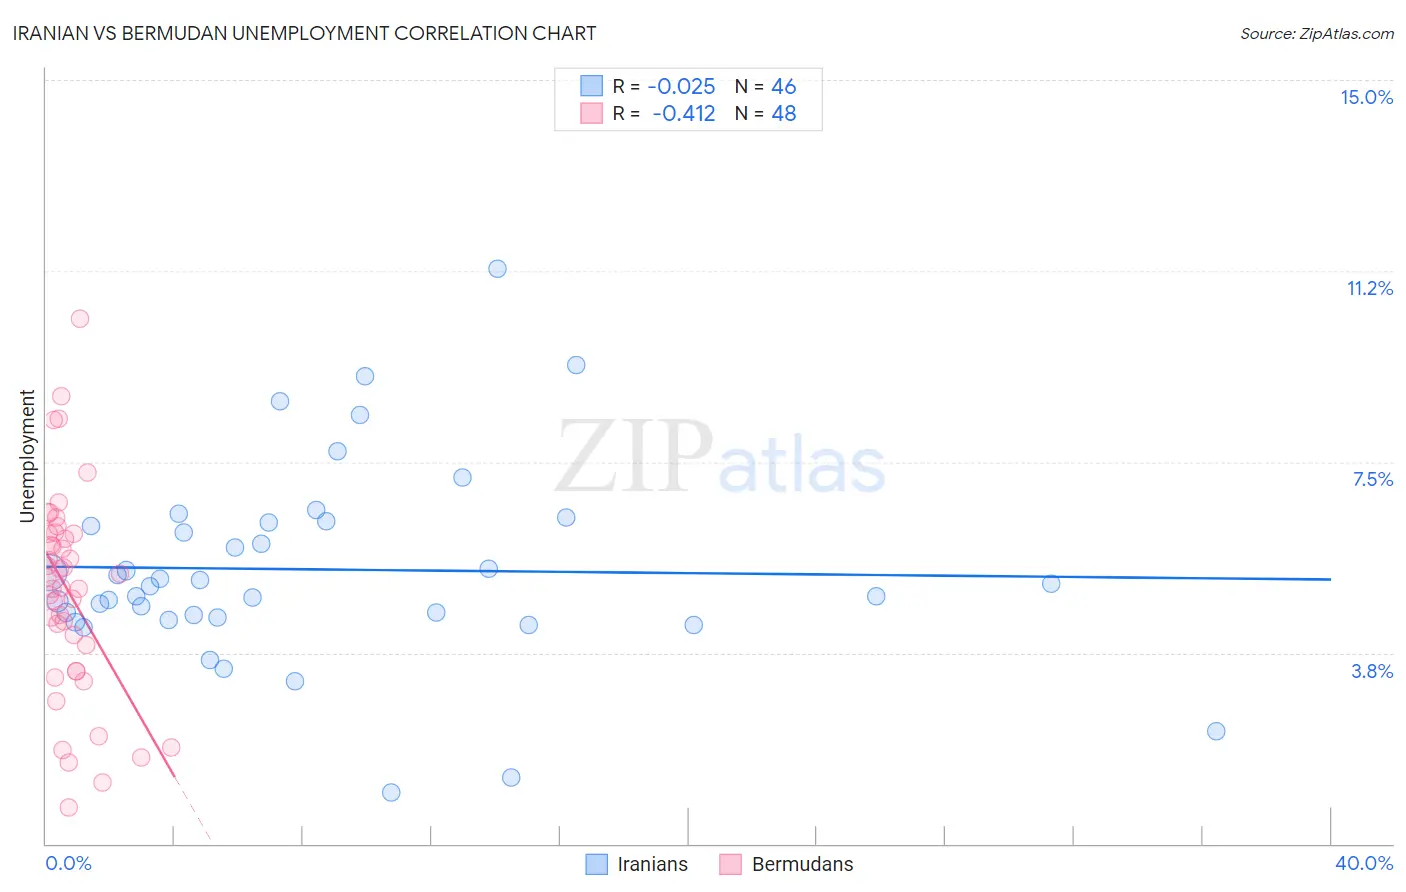
Iranian vs Bermudan Unemployment Correlation Chart
The statistical analysis conducted on geographies consisting of 316,755,420 people shows no correlation between the proportion of Iranians and unemployment in the United States with a correlation coefficient (R) of -0.025 and weighted average of 5.1%. Similarly, the statistical analysis conducted on geographies consisting of 55,703,293 people shows a moderate negative correlation between the proportion of Bermudans and unemployment in the United States with a correlation coefficient (R) of -0.412 and weighted average of 5.6%, a difference of 10.1%.
Unemployment Correlation Summary
| Measurement | Iranian | Bermudan |
| Minimum | 1.0% | 0.70% |
| Maximum | 11.3% | 10.3% |
| Range | 10.3% | 9.6% |
| Mean | 5.4% | 4.9% |
| Median | 5.1% | 5.1% |
| Interquartile 25% (IQ1) | 4.4% | 3.6% |
| Interquartile 75% (IQ3) | 6.3% | 6.1% |
| Interquartile Range (IQR) | 1.9% | 2.4% |
| Standard Deviation (Sample) | 1.9% | 2.0% |
| Standard Deviation (Population) | 1.9% | 2.0% |
Similar Demographics by Unemployment
Demographics Similar to Iranians by Unemployment
In terms of unemployment, the demographic groups most similar to Iranians are Immigrants from Croatia (5.1%, a difference of 0.030%), Immigrants from Ethiopia (5.1%, a difference of 0.030%), Immigrants from Jordan (5.1%, a difference of 0.040%), Immigrants from Europe (5.1%, a difference of 0.090%), and Immigrants from Burma/Myanmar (5.1%, a difference of 0.090%).
| Demographics | Rating | Rank | Unemployment |
| Asians | 89.0 /100 | #123 | Excellent 5.1% |
| Ethiopians | 88.6 /100 | #124 | Excellent 5.1% |
| Immigrants | Eastern Asia | 88.3 /100 | #125 | Excellent 5.1% |
| Kenyans | 88.2 /100 | #126 | Excellent 5.1% |
| Immigrants | Kenya | 88.2 /100 | #127 | Excellent 5.1% |
| Immigrants | Eastern Africa | 88.1 /100 | #128 | Excellent 5.1% |
| Immigrants | Latvia | 88.0 /100 | #129 | Excellent 5.1% |
| Iranians | 86.9 /100 | #130 | Excellent 5.1% |
| Immigrants | Croatia | 86.8 /100 | #131 | Excellent 5.1% |
| Immigrants | Ethiopia | 86.7 /100 | #132 | Excellent 5.1% |
| Immigrants | Jordan | 86.6 /100 | #133 | Excellent 5.1% |
| Immigrants | Europe | 86.3 /100 | #134 | Excellent 5.1% |
| Immigrants | Burma/Myanmar | 86.2 /100 | #135 | Excellent 5.1% |
| Immigrants | Spain | 86.2 /100 | #136 | Excellent 5.1% |
| Immigrants | Saudi Arabia | 85.6 /100 | #137 | Excellent 5.1% |
Demographics Similar to Bermudans by Unemployment
In terms of unemployment, the demographic groups most similar to Bermudans are French American Indian (5.6%, a difference of 0.050%), Dutch West Indian (5.6%, a difference of 0.070%), Immigrants from Cameroon (5.6%, a difference of 0.15%), Marshallese (5.6%, a difference of 0.22%), and Liberian (5.6%, a difference of 0.28%).
| Demographics | Rating | Rank | Unemployment |
| Immigrants | Immigrants | 2.6 /100 | #239 | Tragic 5.5% |
| Cree | 2.6 /100 | #240 | Tragic 5.6% |
| Tlingit-Haida | 2.0 /100 | #241 | Tragic 5.6% |
| Spanish Americans | 2.0 /100 | #242 | Tragic 5.6% |
| Marshallese | 1.3 /100 | #243 | Tragic 5.6% |
| Dutch West Indians | 1.2 /100 | #244 | Tragic 5.6% |
| French American Indians | 1.2 /100 | #245 | Tragic 5.6% |
| Bermudans | 1.1 /100 | #246 | Tragic 5.6% |
| Immigrants | Cameroon | 1.0 /100 | #247 | Tragic 5.6% |
| Liberians | 0.9 /100 | #248 | Tragic 5.6% |
| Cajuns | 0.8 /100 | #249 | Tragic 5.6% |
| Japanese | 0.8 /100 | #250 | Tragic 5.6% |
| Kiowa | 0.6 /100 | #251 | Tragic 5.7% |
| Hondurans | 0.3 /100 | #252 | Tragic 5.7% |
| Central Americans | 0.3 /100 | #253 | Tragic 5.7% |