Inupiat vs Immigrants from Switzerland Unemployment Among Women with Children Under 6 years
COMPARE
Inupiat
Immigrants from Switzerland
Unemployment Among Women with Children Under 6 years
Unemployment Among Women with Children Under 6 years Comparison
Inupiat
Immigrants from Switzerland
17.7%
UNEMPLOYMENT AMONG WOMEN WITH CHILDREN UNDER 6 YEARS
0.0/ 100
METRIC RATING
345th/ 347
METRIC RANK
6.8%
UNEMPLOYMENT AMONG WOMEN WITH CHILDREN UNDER 6 YEARS
99.9/ 100
METRIC RATING
48th/ 347
METRIC RANK
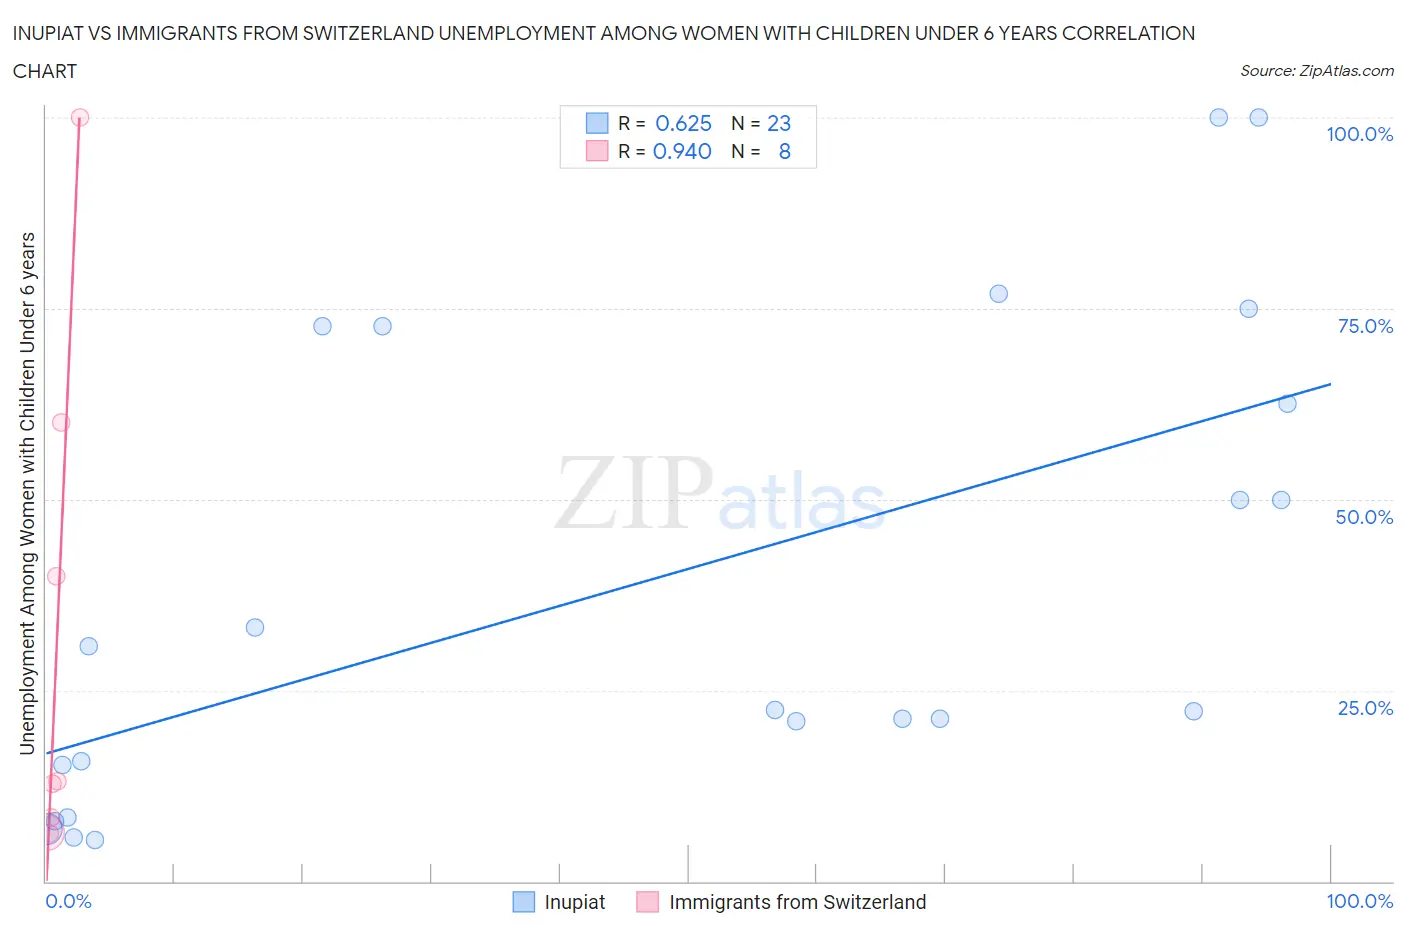
Inupiat vs Immigrants from Switzerland Unemployment Among Women with Children Under 6 years Correlation Chart
The statistical analysis conducted on geographies consisting of 87,378,502 people shows a significant positive correlation between the proportion of Inupiat and unemployment rate among women with children under the age of 6 in the United States with a correlation coefficient (R) of 0.625 and weighted average of 17.7%. Similarly, the statistical analysis conducted on geographies consisting of 124,679,791 people shows a near-perfect positive correlation between the proportion of Immigrants from Switzerland and unemployment rate among women with children under the age of 6 in the United States with a correlation coefficient (R) of 0.940 and weighted average of 6.8%, a difference of 161.1%.
Unemployment Among Women with Children Under 6 years Correlation Summary
| Measurement | Inupiat | Immigrants from Switzerland |
| Minimum | 5.5% | 6.3% |
| Maximum | 100.0% | 100.0% |
| Range | 94.5% | 93.7% |
| Mean | 39.0% | 30.9% |
| Median | 22.4% | 13.0% |
| Interquartile 25% (IQ1) | 15.2% | 7.4% |
| Interquartile 75% (IQ3) | 72.7% | 50.0% |
| Interquartile Range (IQR) | 57.5% | 42.5% |
| Standard Deviation (Sample) | 31.0% | 33.9% |
| Standard Deviation (Population) | 30.3% | 31.7% |
Similar Demographics by Unemployment Among Women with Children Under 6 years
Demographics Similar to Inupiat by Unemployment Among Women with Children Under 6 years
In terms of unemployment among women with children under 6 years, the demographic groups most similar to Inupiat are Hopi (16.8%, a difference of 5.6%), Arapaho (19.0%, a difference of 7.5%), Yup'ik (21.1%, a difference of 18.9%), Crow (14.6%, a difference of 20.9%), and Yuman (14.6%, a difference of 21.0%).
| Demographics | Rating | Rank | Unemployment Among Women with Children Under 6 years |
| Natives/Alaskans | 0.0 /100 | #333 | Tragic 11.5% |
| Apache | 0.0 /100 | #334 | Tragic 12.3% |
| Puerto Ricans | 0.0 /100 | #335 | Tragic 12.5% |
| Shoshone | 0.0 /100 | #336 | Tragic 13.2% |
| Chippewa | 0.0 /100 | #337 | Tragic 13.3% |
| Pima | 0.0 /100 | #338 | Tragic 13.4% |
| Navajo | 0.0 /100 | #339 | Tragic 13.5% |
| Immigrants | Yemen | 0.0 /100 | #340 | Tragic 13.5% |
| Lumbee | 0.0 /100 | #341 | Tragic 13.8% |
| Yuman | 0.0 /100 | #342 | Tragic 14.6% |
| Crow | 0.0 /100 | #343 | Tragic 14.6% |
| Hopi | 0.0 /100 | #344 | Tragic 16.8% |
| Inupiat | 0.0 /100 | #345 | Tragic 17.7% |
| Arapaho | 0.0 /100 | #346 | Tragic 19.0% |
| Yup'ik | 0.0 /100 | #347 | Tragic 21.1% |
Demographics Similar to Immigrants from Switzerland by Unemployment Among Women with Children Under 6 years
In terms of unemployment among women with children under 6 years, the demographic groups most similar to Immigrants from Switzerland are Immigrants from Asia (6.8%, a difference of 0.030%), Immigrants from Nepal (6.8%, a difference of 0.050%), Immigrants from Ireland (6.8%, a difference of 0.060%), Ethiopian (6.8%, a difference of 0.080%), and Immigrants from Iran (6.8%, a difference of 0.19%).
| Demographics | Rating | Rank | Unemployment Among Women with Children Under 6 years |
| Immigrants | Indonesia | 99.9 /100 | #41 | Exceptional 6.7% |
| Immigrants | Cuba | 99.9 /100 | #42 | Exceptional 6.7% |
| Bhutanese | 99.9 /100 | #43 | Exceptional 6.7% |
| Iranians | 99.9 /100 | #44 | Exceptional 6.7% |
| Immigrants | Australia | 99.9 /100 | #45 | Exceptional 6.8% |
| Latvians | 99.9 /100 | #46 | Exceptional 6.8% |
| Immigrants | Asia | 99.9 /100 | #47 | Exceptional 6.8% |
| Immigrants | Switzerland | 99.9 /100 | #48 | Exceptional 6.8% |
| Immigrants | Nepal | 99.9 /100 | #49 | Exceptional 6.8% |
| Immigrants | Ireland | 99.9 /100 | #50 | Exceptional 6.8% |
| Ethiopians | 99.9 /100 | #51 | Exceptional 6.8% |
| Immigrants | Iran | 99.9 /100 | #52 | Exceptional 6.8% |
| Chinese | 99.9 /100 | #53 | Exceptional 6.8% |
| Immigrants | Latvia | 99.9 /100 | #54 | Exceptional 6.8% |
| Immigrants | Ukraine | 99.8 /100 | #55 | Exceptional 6.8% |