Indonesian vs Kiowa Unemployment Among Ages 45 to 54 years
COMPARE
Indonesian
Kiowa
Unemployment Among Ages 45 to 54 years
Unemployment Among Ages 45 to 54 years Comparison
Indonesians
Kiowa
4.4%
UNEMPLOYMENT AMONG AGES 45 TO 54 YEARS
95.4/ 100
METRIC RATING
96th/ 347
METRIC RANK
5.1%
UNEMPLOYMENT AMONG AGES 45 TO 54 YEARS
0.0/ 100
METRIC RATING
284th/ 347
METRIC RANK
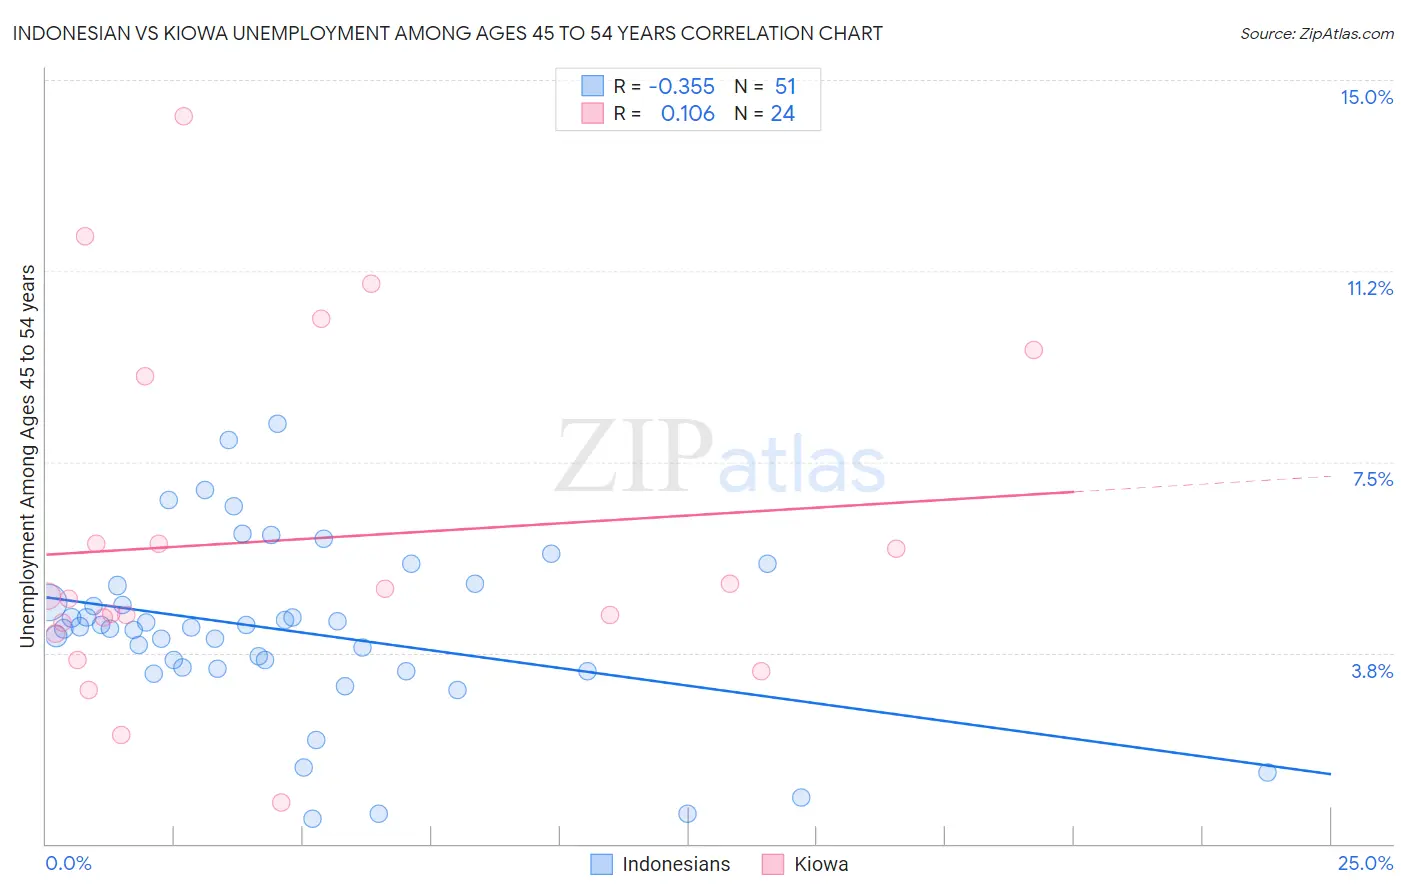
Indonesian vs Kiowa Unemployment Among Ages 45 to 54 years Correlation Chart
The statistical analysis conducted on geographies consisting of 161,009,785 people shows a mild negative correlation between the proportion of Indonesians and unemployment rate among population between the ages 45 and 54 in the United States with a correlation coefficient (R) of -0.355 and weighted average of 4.4%. Similarly, the statistical analysis conducted on geographies consisting of 55,688,709 people shows a poor positive correlation between the proportion of Kiowa and unemployment rate among population between the ages 45 and 54 in the United States with a correlation coefficient (R) of 0.106 and weighted average of 5.1%, a difference of 17.4%.
Unemployment Among Ages 45 to 54 years Correlation Summary
| Measurement | Indonesian | Kiowa |
| Minimum | 0.50% | 0.80% |
| Maximum | 8.3% | 14.3% |
| Range | 7.8% | 13.5% |
| Mean | 4.2% | 6.0% |
| Median | 4.3% | 4.8% |
| Interquartile 25% (IQ1) | 3.4% | 4.2% |
| Interquartile 75% (IQ3) | 5.1% | 7.5% |
| Interquartile Range (IQR) | 1.6% | 3.3% |
| Standard Deviation (Sample) | 1.7% | 3.3% |
| Standard Deviation (Population) | 1.7% | 3.3% |
Similar Demographics by Unemployment Among Ages 45 to 54 years
Demographics Similar to Indonesians by Unemployment Among Ages 45 to 54 years
In terms of unemployment among ages 45 to 54 years, the demographic groups most similar to Indonesians are Immigrants from Canada (4.4%, a difference of 0.13%), Romanian (4.4%, a difference of 0.13%), Immigrants from Burma/Myanmar (4.4%, a difference of 0.15%), Immigrants from Eritrea (4.4%, a difference of 0.18%), and Immigrants from Ethiopia (4.4%, a difference of 0.19%).
| Demographics | Rating | Rank | Unemployment Among Ages 45 to 54 years |
| Immigrants | Argentina | 96.9 /100 | #89 | Exceptional 4.3% |
| Asians | 96.8 /100 | #90 | Exceptional 4.3% |
| Ukrainians | 96.6 /100 | #91 | Exceptional 4.3% |
| Mongolians | 96.6 /100 | #92 | Exceptional 4.3% |
| Argentineans | 96.5 /100 | #93 | Exceptional 4.3% |
| Immigrants | Malaysia | 96.2 /100 | #94 | Exceptional 4.4% |
| Immigrants | Ethiopia | 96.1 /100 | #95 | Exceptional 4.4% |
| Indonesians | 95.4 /100 | #96 | Exceptional 4.4% |
| Immigrants | Canada | 95.0 /100 | #97 | Exceptional 4.4% |
| Romanians | 94.9 /100 | #98 | Exceptional 4.4% |
| Immigrants | Burma/Myanmar | 94.9 /100 | #99 | Exceptional 4.4% |
| Immigrants | Eritrea | 94.7 /100 | #100 | Exceptional 4.4% |
| Immigrants | North America | 93.9 /100 | #101 | Exceptional 4.4% |
| Sri Lankans | 93.7 /100 | #102 | Exceptional 4.4% |
| Icelanders | 93.5 /100 | #103 | Exceptional 4.4% |
Demographics Similar to Kiowa by Unemployment Among Ages 45 to 54 years
In terms of unemployment among ages 45 to 54 years, the demographic groups most similar to Kiowa are Iroquois (5.1%, a difference of 0.020%), Senegalese (5.1%, a difference of 0.18%), Hispanic or Latino (5.1%, a difference of 0.65%), Haitian (5.2%, a difference of 1.0%), and African (5.1%, a difference of 1.1%).
| Demographics | Rating | Rank | Unemployment Among Ages 45 to 54 years |
| Immigrants | Mexico | 0.0 /100 | #277 | Tragic 5.0% |
| Dutch West Indians | 0.0 /100 | #278 | Tragic 5.0% |
| Nepalese | 0.0 /100 | #279 | Tragic 5.0% |
| Blackfeet | 0.0 /100 | #280 | Tragic 5.1% |
| Spanish American Indians | 0.0 /100 | #281 | Tragic 5.1% |
| Africans | 0.0 /100 | #282 | Tragic 5.1% |
| Hispanics or Latinos | 0.0 /100 | #283 | Tragic 5.1% |
| Kiowa | 0.0 /100 | #284 | Tragic 5.1% |
| Iroquois | 0.0 /100 | #285 | Tragic 5.1% |
| Senegalese | 0.0 /100 | #286 | Tragic 5.1% |
| Haitians | 0.0 /100 | #287 | Tragic 5.2% |
| Immigrants | Caribbean | 0.0 /100 | #288 | Tragic 5.2% |
| Immigrants | Haiti | 0.0 /100 | #289 | Tragic 5.2% |
| Immigrants | Portugal | 0.0 /100 | #290 | Tragic 5.2% |
| Armenians | 0.0 /100 | #291 | Tragic 5.2% |