Indonesian vs Immigrants from Yemen Unemployment

COMPARE

Indonesian
Race
Ancestry
AfghanAfricanAlaska NativeAlaskan AthabascanAlbanianAleutAlsatianAmericanApacheArabArapahoArgentineanArmenianAssyrian/Chaldean/SyriacAustralianAustrianBahamianBangladeshiBarbadianBasqueBelgianBelizeanBermudanBhutaneseBlackfeetBolivianBrazilianBritishBritish West IndianBulgarianBurmeseCajunCambodianCanadianCape VerdeanCarpatho RusynCelticCentral AmericanCentral American IndianCherokeeCheyenneChickasawChileanChineseChippewaChoctawColombianColvilleComancheCosta RicanCreeCreekCroatianCrowCubanCypriotCzechCzechoslovakianDanishDelawareDominicanDutchDutch West IndianEastern EuropeanEcuadorianEgyptianEnglishEstonianEthiopianEuropeanFijianFilipinoFinnishFrenchFrench American IndianFrench CanadianGermanGerman RussianGhanaianGreekGuamanian/ChamorroGuatemalanGuyaneseHaitianHmongHonduranHopiHoumaHungarianIcelanderIndian (Asian)IndonesianInupiatIranianIraqiIrishIroquoisIsraeliItalianJamaicanJapaneseJordanianKenyanKiowaKoreanLaotianLatvianLebaneseLiberianLithuanianLumbeeLuxembourgerMacedonianMalaysianMalteseMarshalleseMenomineeMexicanMexican American IndianMongolianMoroccanNative HawaiianNavajoNepaleseNew ZealanderNicaraguanNigerianNorthern EuropeanNorwegianOkinawanOsageOttawaPaiutePakistaniPalestinianPanamanianParaguayanPennsylvania GermanPeruvianPimaPolishPortuguesePotawatomiPuebloPuerto RicanPuget Sound SalishRomanianRussianSalvadoranSamoanScandinavianScotch-IrishScottishSeminoleSenegaleseSerbianShoshoneSierra LeoneanSiouxSlavicSlovakSloveneSomaliSouth AfricanSouth AmericanSouth American IndianSoviet UnionSpaniardSpanishSpanish AmericanSpanish American IndianSri LankanSubsaharan AfricanSudaneseSwedishSwissSyrianTaiwaneseThaiTlingit-HaidaTohono O'OdhamTonganTrinidadian and TobagonianTsimshianTurkishU.S. Virgin IslanderUgandanUkrainianUruguayanUteVenezuelanVietnameseWelshWest IndianYakamaYaquiYugoslavianYumanYup'ikZimbabwean
Immigration
NonimmigrantsImmigrantsAfghanistanAfricaAlbaniaArgentinaArmeniaAsiaAustraliaAustriaBahamasBangladeshBarbadosBelarusBelgiumBelizeBoliviaBosnia and HerzegovinaBrazilBulgariaBurma/MyanmarCabo VerdeCambodiaCameroonCanadaCaribbeanCentral AmericaChileChinaColombiaCongoCosta RicaCroatiaCubaCzechoslovakiaDenmarkDominicaDominican RepublicEastern AfricaEastern AsiaEastern EuropeEcuadorEgyptEl SalvadorEnglandEritreaEthiopiaEuropeFijiFranceGermanyGhanaGreeceGrenadaGuatemalaGuyanaHaitiHondurasHong KongHungaryIndiaIndonesiaIranIraqIrelandIsraelItalyJamaicaJapanJordanKazakhstanKenyaKoreaKuwaitLaosLatin AmericaLatviaLebanonLiberiaLithuaniaMalaysiaMexicoMicronesiaMiddle AfricaMoldovaMoroccoNepalNetherlandsNicaraguaNigeriaNorth AmericaNorth MacedoniaNorthern AfricaNorthern EuropeNorwayOceaniaPakistanPanamaPeruPhilippinesPolandPortugalRomaniaRussiaSaudi ArabiaScotlandSenegalSerbiaSierra LeoneSingaporeSomaliaSouth AfricaSouth AmericaSouth Central AsiaSouth Eastern AsiaSouthern EuropeSpainSri LankaSt. Vincent and the GrenadinesSudanSwedenSwitzerlandSyriaTaiwanThailandTrinidad and TobagoTurkeyUgandaUkraineUruguayUzbekistanVenezuelaVietnamWest IndiesWestern AfricaWestern AsiaWestern EuropeZaireZimbabweAzores
Immigrants from Yemen
Race
Ancestry
AfghanAfricanAlaska NativeAlaskan AthabascanAlbanianAleutAlsatianAmericanApacheArabArapahoArgentineanArmenianAssyrian/Chaldean/SyriacAustralianAustrianBahamianBangladeshiBarbadianBasqueBelgianBelizeanBermudanBhutaneseBlackfeetBolivianBrazilianBritishBritish West IndianBulgarianBurmeseCajunCambodianCanadianCape VerdeanCarpatho RusynCelticCentral AmericanCentral American IndianCherokeeCheyenneChickasawChileanChineseChippewaChoctawColombianColvilleComancheCosta RicanCreeCreekCroatianCrowCubanCypriotCzechCzechoslovakianDanishDelawareDominicanDutchDutch West IndianEastern EuropeanEcuadorianEgyptianEnglishEstonianEthiopianEuropeanFijianFilipinoFinnishFrenchFrench American IndianFrench CanadianGermanGerman RussianGhanaianGreekGuamanian/ChamorroGuatemalanGuyaneseHaitianHmongHonduranHopiHoumaHungarianIcelanderIndian (Asian)InupiatIranianIraqiIrishIroquoisIsraeliItalianJamaicanJapaneseJordanianKenyanKiowaKoreanLaotianLatvianLebaneseLiberianLithuanianLumbeeLuxembourgerMacedonianMalaysianMalteseMarshalleseMenomineeMexicanMexican American IndianMongolianMoroccanNative HawaiianNavajoNepaleseNew ZealanderNicaraguanNigerianNorthern EuropeanNorwegianOkinawanOsageOttawaPaiutePakistaniPalestinianPanamanianParaguayanPennsylvania GermanPeruvianPimaPolishPortuguesePotawatomiPuebloPuerto RicanPuget Sound SalishRomanianRussianSalvadoranSamoanScandinavianScotch-IrishScottishSeminoleSenegaleseSerbianShoshoneSierra LeoneanSiouxSlavicSlovakSloveneSomaliSouth AfricanSouth AmericanSouth American IndianSoviet UnionSpaniardSpanishSpanish AmericanSpanish American IndianSri LankanSubsaharan AfricanSudaneseSwedishSwissSyrianTaiwaneseThaiTlingit-HaidaTohono O'OdhamTonganTrinidadian and TobagonianTsimshianTurkishU.S. Virgin IslanderUgandanUkrainianUruguayanUteVenezuelanVietnameseWelshWest IndianYakamaYaquiYugoslavianYumanYup'ikZimbabwean
Immigration
NonimmigrantsImmigrantsAfghanistanAfricaAlbaniaArgentinaArmeniaAsiaAustraliaAustriaBahamasBangladeshBarbadosBelarusBelgiumBelizeBoliviaBosnia and HerzegovinaBrazilBulgariaBurma/MyanmarCabo VerdeCambodiaCameroonCanadaCaribbeanCentral AmericaChileChinaColombiaCongoCosta RicaCroatiaCubaCzechoslovakiaDenmarkDominicaDominican RepublicEastern AfricaEastern AsiaEastern EuropeEcuadorEgyptEl SalvadorEnglandEritreaEthiopiaEuropeFijiFranceGermanyGhanaGreeceGrenadaGuatemalaGuyanaHaitiHondurasHong KongHungaryIndiaIndonesiaIranIraqIrelandIsraelItalyJamaicaJapanJordanKazakhstanKenyaKoreaKuwaitLaosLatin AmericaLatviaLebanonLiberiaLithuaniaMalaysiaMexicoMicronesiaMiddle AfricaMoldovaMoroccoNepalNetherlandsNicaraguaNigeriaNorth AmericaNorth MacedoniaNorthern AfricaNorthern EuropeNorwayOceaniaPakistanPanamaPeruPhilippinesPolandPortugalRomaniaRussiaSaudi ArabiaScotlandSenegalSerbiaSierra LeoneSingaporeSomaliaSouth AfricaSouth AmericaSouth Central AsiaSouth Eastern AsiaSouthern EuropeSpainSri LankaSt. Vincent and the GrenadinesSudanSwedenSwitzerlandSyriaTaiwanThailandTrinidad and TobagoTurkeyUgandaUkraineUruguayUzbekistanVenezuelaVietnamWest IndiesWestern AfricaWestern AsiaWestern EuropeYemenZaireZimbabweAzores
Unemployment
Income
Poverty
Unemployment
Labor Participation
Family Structure
Vehicle Availability
Education Level
Disability

Unemployment Comparison

Indonesians

Immigrants from Yemen

Excellent
Tragic
5.1%
UNEMPLOYMENT
82.3/ 100
METRIC RATING
144th/ 347
METRIC RANK
7.7%
UNEMPLOYMENT
0.0/ 100
METRIC RATING
336th/ 347
METRIC RANK

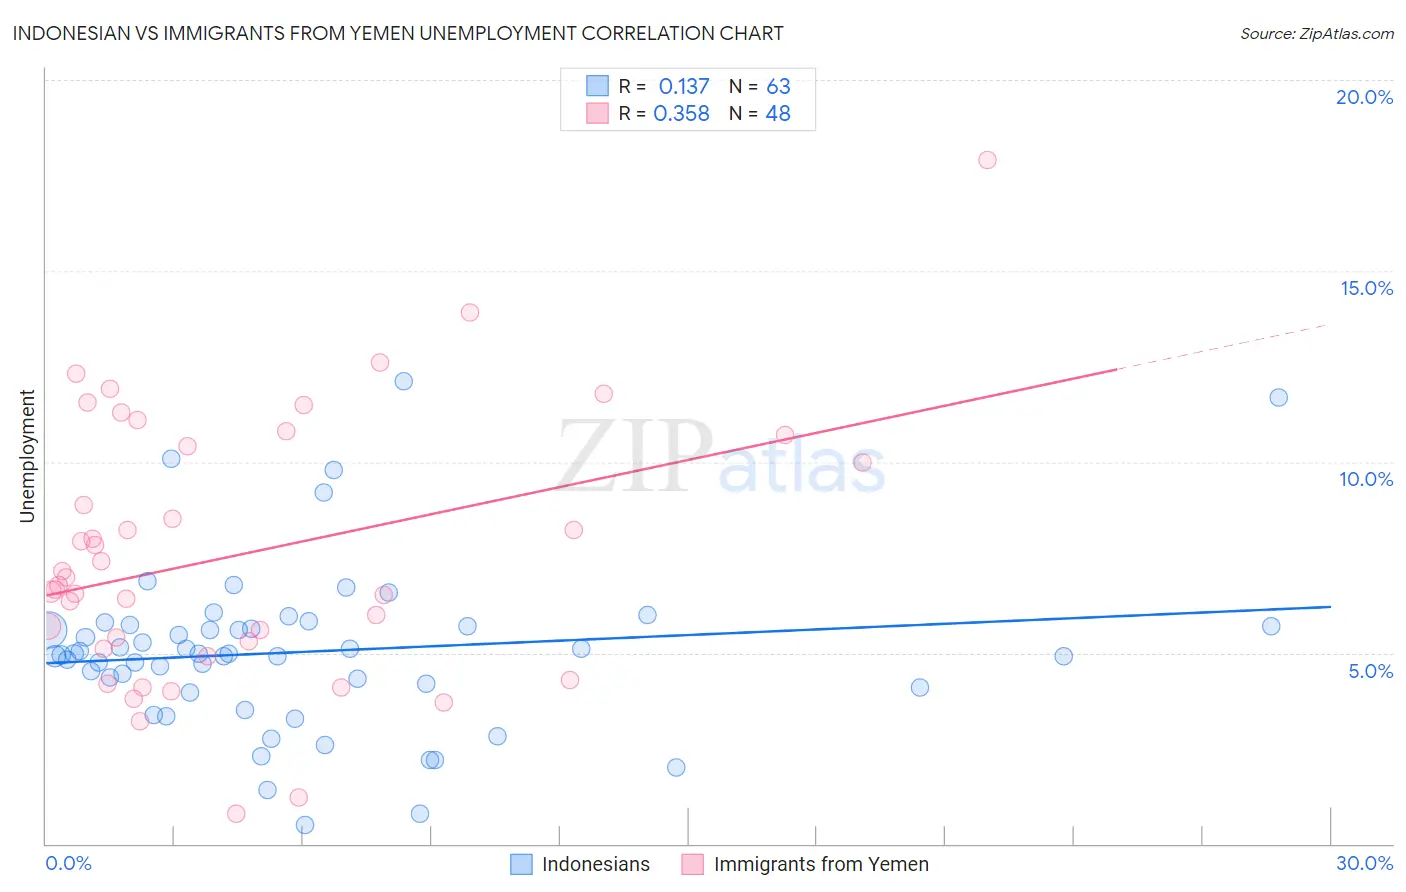
Indonesian vs Immigrants from Yemen Unemployment Correlation Chart

The statistical analysis conducted on geographies consisting of 162,697,031 people shows a poor positive correlation between the proportion of Indonesians and unemployment in the United States with a correlation coefficient (R) of 0.137 and weighted average of 5.1%. Similarly, the statistical analysis conducted on geographies consisting of 82,429,488 people shows a mild positive correlation between the proportion of Immigrants from Yemen and unemployment in the United States with a correlation coefficient (R) of 0.358 and weighted average of 7.7%, a difference of 50.1%.
Indonesian vs Immigrants from Yemen Unemployment

Unemployment Correlation Summary

MeasurementIndonesianImmigrants from Yemen
Minimum0.50%0.80%
Maximum12.1%17.9%
Range11.6%17.1%
Mean5.0%7.6%
Median5.0%6.9%
Interquartile 25% (IQ1)4.1%5.2%
Interquartile 75% (IQ3)5.7%10.6%
Interquartile Range (IQR)1.6%5.4%
Standard Deviation (Sample)2.2%3.5%
Standard Deviation (Population)2.2%3.4%

Similar Demographics by Unemployment

Demographics Similar to Indonesians by Unemployment

In terms of unemployment, the demographic groups most similar to Indonesians are Immigrants from Chile (5.1%, a difference of 0.050%), Immigrants from Norway (5.1%, a difference of 0.050%), Immigrants from Asia (5.1%, a difference of 0.060%), Indian (Asian) (5.1%, a difference of 0.070%), and Immigrants from Pakistan (5.1%, a difference of 0.10%).
DemographicsRating | RankUnemployment
Immigrants | Saudi Arabia
85.6
/100
|
#137
Excellent
5.1%
Immigrants | Hungary
85.6
/100
|
#138
Excellent
5.1%
Pakistanis
85.3
/100
|
#139
Excellent
5.1%
Immigrants | Denmark
84.3
/100
|
#140
Excellent
5.1%
Palestinians
83.4
/100
|
#141
Excellent
5.1%
Immigrants | Pakistan
83.2
/100
|
#142
Excellent
5.1%
Immigrants | Chile
82.8
/100
|
#143
Excellent
5.1%
Indonesians
82.3
/100
|
#144
Excellent
5.1%
Immigrants | Norway
81.8
/100
|
#145
Excellent
5.1%
Immigrants | Asia
81.8
/100
|
#146
Excellent
5.1%
Indians (Asian)
81.6
/100
|
#147
Excellent
5.1%
Immigrants | Italy
79.1
/100
|
#148
Good
5.1%
Syrians
77.7
/100
|
#149
Good
5.2%
Potawatomi
76.2
/100
|
#150
Good
5.2%
Immigrants | Eastern Europe
75.3
/100
|
#151
Good
5.2%

Demographics Similar to Immigrants from Yemen by Unemployment

In terms of unemployment, the demographic groups most similar to Immigrants from Yemen are Alaskan Athabascan (7.7%, a difference of 0.72%), Apache (7.4%, a difference of 3.8%), Cheyenne (8.0%, a difference of 3.8%), Immigrants from Dominican Republic (7.4%, a difference of 4.3%), and Sioux (7.4%, a difference of 4.3%).
DemographicsRating | RankUnemployment
Alaska Natives
0.0
/100
|
#329
Tragic
7.2%
Yakama
0.0
/100
|
#330
Tragic
7.3%
Dominicans
0.0
/100
|
#331
Tragic
7.4%
Sioux
0.0
/100
|
#332
Tragic
7.4%
Immigrants | Dominican Republic
0.0
/100
|
#333
Tragic
7.4%
Apache
0.0
/100
|
#334
Tragic
7.4%
Alaskan Athabascans
0.0
/100
|
#335
Tragic
7.7%
Immigrants | Yemen
0.0
/100
|
#336
Tragic
7.7%
Cheyenne
0.0
/100
|
#337
Tragic
8.0%
Pima
0.0
/100
|
#338
Tragic
8.2%
Navajo
0.0
/100
|
#339
Tragic
8.4%
Puerto Ricans
0.0
/100
|
#340
Tragic
8.4%
Tohono O'odham
0.0
/100
|
#341
Tragic
8.9%
Hopi
0.0
/100
|
#342
Tragic
8.9%
Yuman
0.0
/100
|
#343
Tragic
9.1%