Indonesian vs Cape Verdean Male Unemployment
COMPARE
Indonesian
Cape Verdean
Male Unemployment
Male Unemployment Comparison
Indonesians
Cape Verdeans
5.2%
MALE UNEMPLOYMENT
71.2/ 100
METRIC RATING
159th/ 347
METRIC RANK
7.1%
MALE UNEMPLOYMENT
0.0/ 100
METRIC RATING
318th/ 347
METRIC RANK
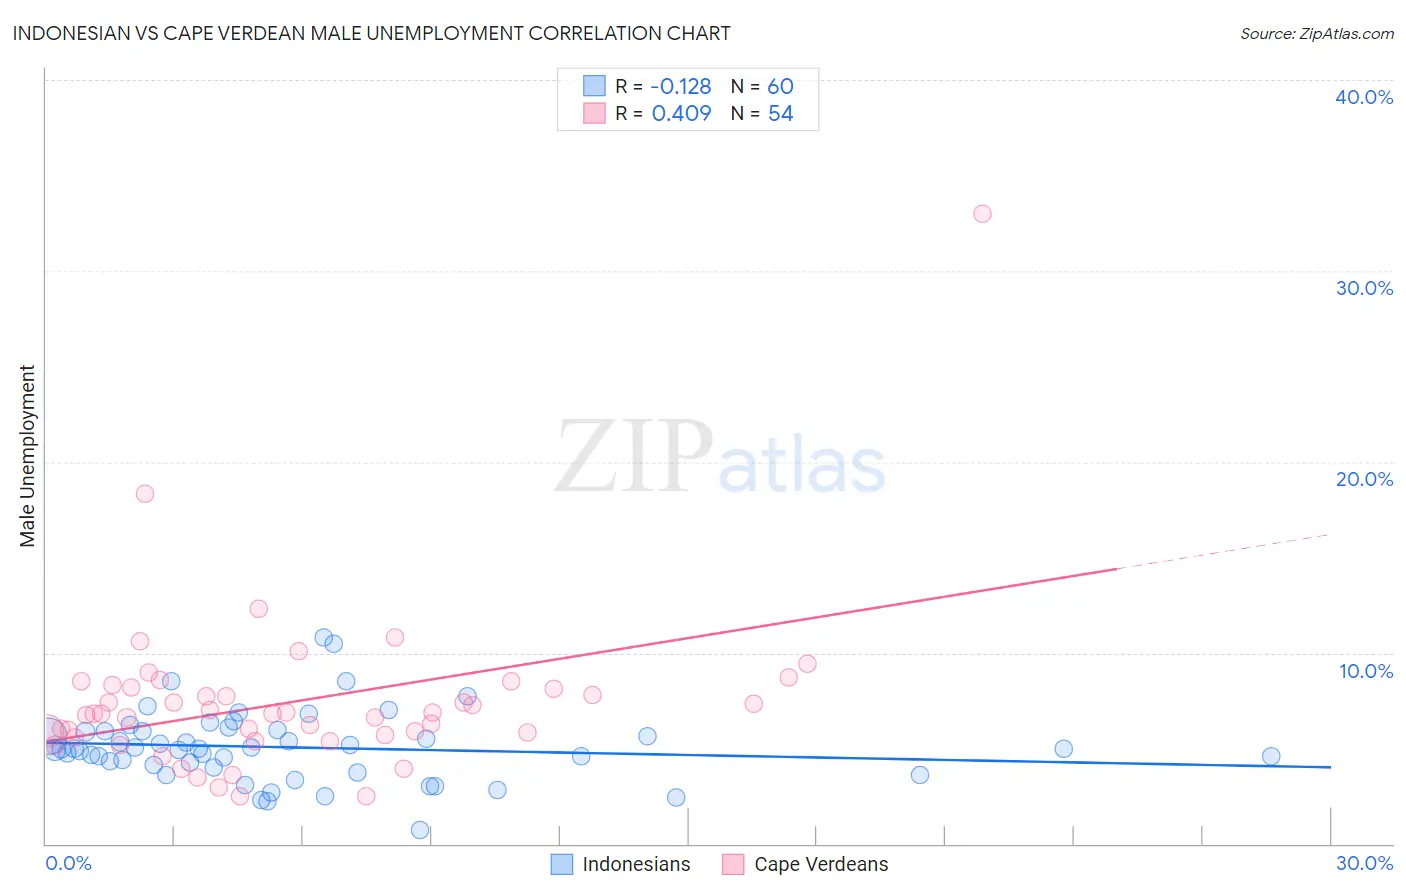
Indonesian vs Cape Verdean Male Unemployment Correlation Chart
The statistical analysis conducted on geographies consisting of 162,567,478 people shows a poor negative correlation between the proportion of Indonesians and unemployment rate among males in the United States with a correlation coefficient (R) of -0.128 and weighted average of 5.2%. Similarly, the statistical analysis conducted on geographies consisting of 107,471,642 people shows a moderate positive correlation between the proportion of Cape Verdeans and unemployment rate among males in the United States with a correlation coefficient (R) of 0.409 and weighted average of 7.1%, a difference of 36.3%.
Male Unemployment Correlation Summary
| Measurement | Indonesian | Cape Verdean |
| Minimum | 0.70% | 2.5% |
| Maximum | 10.8% | 33.0% |
| Range | 10.1% | 30.5% |
| Mean | 5.0% | 7.4% |
| Median | 5.0% | 6.8% |
| Interquartile 25% (IQ1) | 4.0% | 5.7% |
| Interquartile 75% (IQ3) | 5.9% | 8.2% |
| Interquartile Range (IQR) | 1.8% | 2.5% |
| Standard Deviation (Sample) | 1.9% | 4.4% |
| Standard Deviation (Population) | 1.8% | 4.3% |
Similar Demographics by Male Unemployment
Demographics Similar to Indonesians by Male Unemployment
In terms of male unemployment, the demographic groups most similar to Indonesians are Immigrants from Norway (5.2%, a difference of 0.010%), Immigrants from Indonesia (5.2%, a difference of 0.030%), Immigrants from China (5.2%, a difference of 0.040%), Immigrants from Northern Africa (5.2%, a difference of 0.080%), and American (5.2%, a difference of 0.11%).
| Demographics | Rating | Rank | Male Unemployment |
| Egyptians | 74.8 /100 | #152 | Good 5.2% |
| Immigrants | Uruguay | 73.9 /100 | #153 | Good 5.2% |
| Laotians | 73.8 /100 | #154 | Good 5.2% |
| Immigrants | Hungary | 73.4 /100 | #155 | Good 5.2% |
| Americans | 72.7 /100 | #156 | Good 5.2% |
| Immigrants | Northern Africa | 72.3 /100 | #157 | Good 5.2% |
| Immigrants | Indonesia | 71.5 /100 | #158 | Good 5.2% |
| Indonesians | 71.2 /100 | #159 | Good 5.2% |
| Immigrants | Norway | 71.0 /100 | #160 | Good 5.2% |
| Immigrants | China | 70.6 /100 | #161 | Good 5.2% |
| Immigrants | Egypt | 65.9 /100 | #162 | Good 5.2% |
| Immigrants | Hong Kong | 65.7 /100 | #163 | Good 5.2% |
| Afghans | 62.0 /100 | #164 | Good 5.3% |
| South Americans | 60.6 /100 | #165 | Good 5.3% |
| Immigrants | Morocco | 60.2 /100 | #166 | Good 5.3% |
Demographics Similar to Cape Verdeans by Male Unemployment
In terms of male unemployment, the demographic groups most similar to Cape Verdeans are Guyanese (7.1%, a difference of 0.070%), Immigrants from Guyana (7.1%, a difference of 0.12%), Houma (7.1%, a difference of 0.15%), Immigrants from Barbados (7.1%, a difference of 0.36%), and Immigrants from Dominica (7.0%, a difference of 1.6%).
| Demographics | Rating | Rank | Male Unemployment |
| Immigrants | Armenia | 0.0 /100 | #311 | Tragic 6.9% |
| Lumbee | 0.0 /100 | #312 | Tragic 6.9% |
| Immigrants | Dominica | 0.0 /100 | #313 | Tragic 7.0% |
| Immigrants | Barbados | 0.0 /100 | #314 | Tragic 7.1% |
| Houma | 0.0 /100 | #315 | Tragic 7.1% |
| Immigrants | Guyana | 0.0 /100 | #316 | Tragic 7.1% |
| Guyanese | 0.0 /100 | #317 | Tragic 7.1% |
| Cape Verdeans | 0.0 /100 | #318 | Tragic 7.1% |
| British West Indians | 0.0 /100 | #319 | Tragic 7.3% |
| Colville | 0.0 /100 | #320 | Tragic 7.4% |
| Immigrants | St. Vincent and the Grenadines | 0.0 /100 | #321 | Tragic 7.5% |
| Immigrants | Cabo Verde | 0.0 /100 | #322 | Tragic 7.5% |
| Immigrants | Grenada | 0.0 /100 | #323 | Tragic 7.6% |
| Dominicans | 0.0 /100 | #324 | Tragic 7.6% |
| Shoshone | 0.0 /100 | #325 | Tragic 7.6% |