Indonesian vs Arab Unemployment Among Ages 16 to 19 years
COMPARE
Indonesian
Arab
Unemployment Among Ages 16 to 19 years
Unemployment Among Ages 16 to 19 years Comparison
Indonesians
Arabs
15.5%
UNEMPLOYMENT AMONG AGES 16 TO 19 YEARS
100.0/ 100
METRIC RATING
11th/ 347
METRIC RANK
17.2%
UNEMPLOYMENT AMONG AGES 16 TO 19 YEARS
83.9/ 100
METRIC RATING
132nd/ 347
METRIC RANK
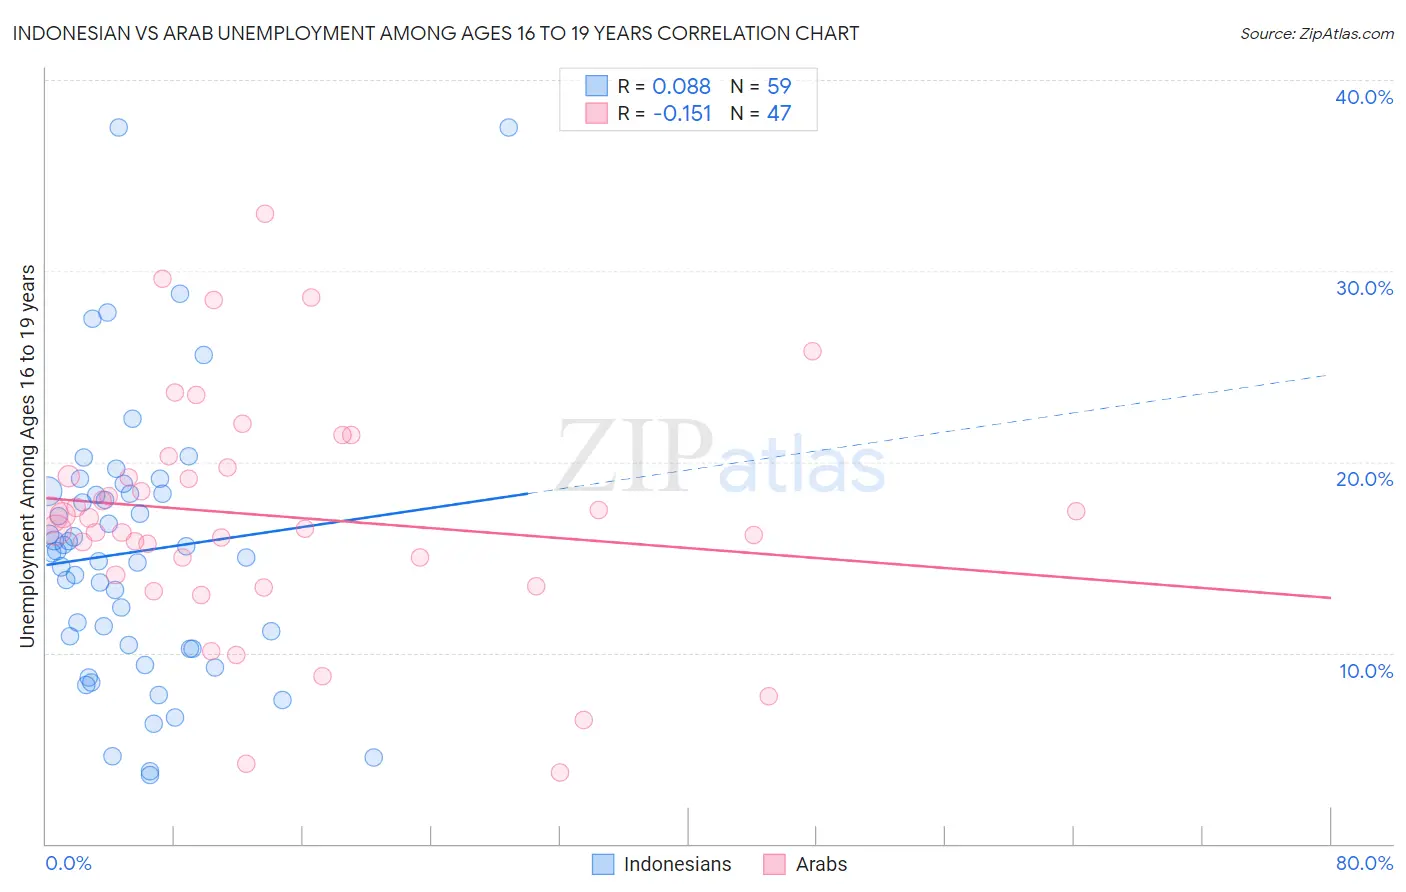
Indonesian vs Arab Unemployment Among Ages 16 to 19 years Correlation Chart
The statistical analysis conducted on geographies consisting of 159,445,213 people shows a slight positive correlation between the proportion of Indonesians and unemployment rate among population between the ages 16 and 19 in the United States with a correlation coefficient (R) of 0.088 and weighted average of 15.5%. Similarly, the statistical analysis conducted on geographies consisting of 454,462,902 people shows a poor negative correlation between the proportion of Arabs and unemployment rate among population between the ages 16 and 19 in the United States with a correlation coefficient (R) of -0.151 and weighted average of 17.2%, a difference of 11.1%.
Unemployment Among Ages 16 to 19 years Correlation Summary
| Measurement | Indonesian | Arab |
| Minimum | 3.6% | 3.7% |
| Maximum | 37.5% | 33.0% |
| Range | 33.9% | 29.3% |
| Mean | 15.3% | 17.2% |
| Median | 15.3% | 17.1% |
| Interquartile 25% (IQ1) | 10.2% | 14.1% |
| Interquartile 75% (IQ3) | 18.3% | 19.7% |
| Interquartile Range (IQR) | 8.1% | 5.7% |
| Standard Deviation (Sample) | 7.1% | 6.1% |
| Standard Deviation (Population) | 7.1% | 6.1% |
Similar Demographics by Unemployment Among Ages 16 to 19 years
Demographics Similar to Indonesians by Unemployment Among Ages 16 to 19 years
In terms of unemployment among ages 16 to 19 years, the demographic groups most similar to Indonesians are Taiwanese (15.5%, a difference of 0.10%), Zimbabwean (15.4%, a difference of 0.42%), Scandinavian (15.4%, a difference of 0.53%), Immigrants from Burma/Myanmar (15.6%, a difference of 0.53%), and Immigrants from Zaire (15.6%, a difference of 0.68%).
| Demographics | Rating | Rank | Unemployment Among Ages 16 to 19 years |
| Danes | 100.0 /100 | #4 | Exceptional 15.2% |
| Immigrants | Somalia | 100.0 /100 | #5 | Exceptional 15.3% |
| Swedes | 100.0 /100 | #6 | Exceptional 15.3% |
| Immigrants | Bosnia and Herzegovina | 100.0 /100 | #7 | Exceptional 15.3% |
| Czechs | 100.0 /100 | #8 | Exceptional 15.4% |
| Scandinavians | 100.0 /100 | #9 | Exceptional 15.4% |
| Zimbabweans | 100.0 /100 | #10 | Exceptional 15.4% |
| Indonesians | 100.0 /100 | #11 | Exceptional 15.5% |
| Taiwanese | 100.0 /100 | #12 | Exceptional 15.5% |
| Immigrants | Burma/Myanmar | 100.0 /100 | #13 | Exceptional 15.6% |
| Immigrants | Zaire | 100.0 /100 | #14 | Exceptional 15.6% |
| Yugoslavians | 100.0 /100 | #15 | Exceptional 15.6% |
| Germans | 100.0 /100 | #16 | Exceptional 15.7% |
| Somalis | 100.0 /100 | #17 | Exceptional 15.7% |
| Thais | 100.0 /100 | #18 | Exceptional 15.7% |
Demographics Similar to Arabs by Unemployment Among Ages 16 to 19 years
In terms of unemployment among ages 16 to 19 years, the demographic groups most similar to Arabs are Laotian (17.2%, a difference of 0.010%), Potawatomi (17.2%, a difference of 0.010%), German Russian (17.2%, a difference of 0.020%), Samoan (17.2%, a difference of 0.020%), and Immigrants from Indonesia (17.2%, a difference of 0.070%).
| Demographics | Rating | Rank | Unemployment Among Ages 16 to 19 years |
| Immigrants | Germany | 87.7 /100 | #125 | Excellent 17.2% |
| Immigrants | Bolivia | 86.7 /100 | #126 | Excellent 17.2% |
| Pakistanis | 85.8 /100 | #127 | Excellent 17.2% |
| Australians | 85.6 /100 | #128 | Excellent 17.2% |
| Creek | 85.5 /100 | #129 | Excellent 17.2% |
| Immigrants | Indonesia | 84.7 /100 | #130 | Excellent 17.2% |
| German Russians | 84.1 /100 | #131 | Excellent 17.2% |
| Arabs | 83.9 /100 | #132 | Excellent 17.2% |
| Laotians | 83.9 /100 | #133 | Excellent 17.2% |
| Potawatomi | 83.8 /100 | #134 | Excellent 17.2% |
| Samoans | 83.7 /100 | #135 | Excellent 17.2% |
| Immigrants | Oceania | 83.1 /100 | #136 | Excellent 17.2% |
| Immigrants | Malaysia | 82.8 /100 | #137 | Excellent 17.2% |
| Bolivians | 81.9 /100 | #138 | Excellent 17.3% |
| Immigrants | Eritrea | 81.1 /100 | #139 | Excellent 17.3% |