Immigrants vs Immigrants from Bahamas Unemployment Among Youth under 25 years
COMPARE
Immigrants
Immigrants from Bahamas
Unemployment Among Youth under 25 years
Unemployment Among Youth under 25 years Comparison
Immigrants
Immigrants from Bahamas
12.1%
UNEMPLOYMENT AMONG YOUTH UNDER 25 YEARS
1.3/ 100
METRIC RATING
236th/ 347
METRIC RANK
12.9%
UNEMPLOYMENT AMONG YOUTH UNDER 25 YEARS
0.0/ 100
METRIC RATING
271st/ 347
METRIC RANK
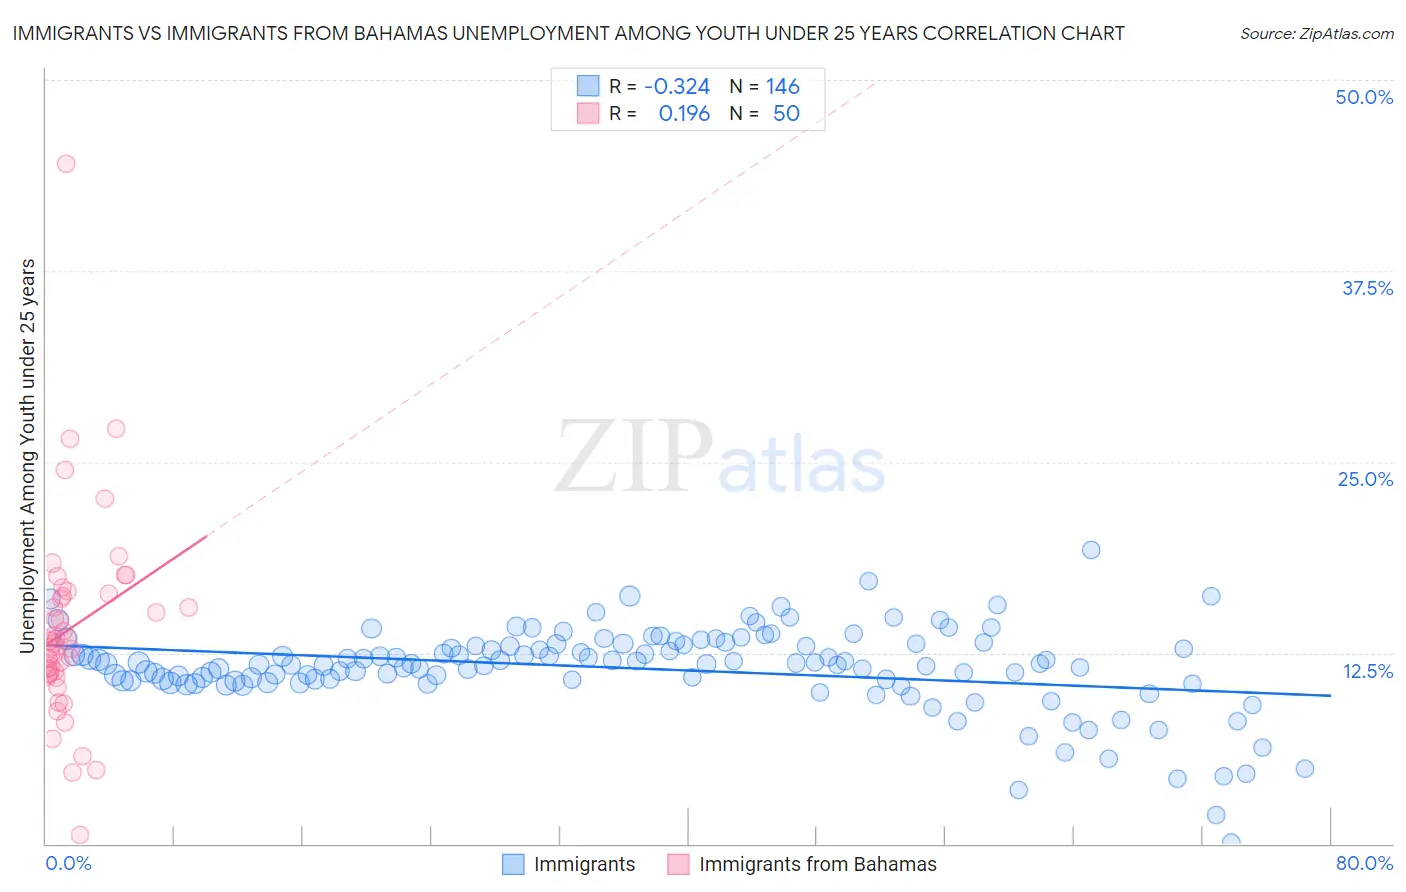
Immigrants vs Immigrants from Bahamas Unemployment Among Youth under 25 years Correlation Chart
The statistical analysis conducted on geographies consisting of 552,441,659 people shows a mild negative correlation between the proportion of Immigrants and unemployment rate among youth under the age of 25 in the United States with a correlation coefficient (R) of -0.324 and weighted average of 12.1%. Similarly, the statistical analysis conducted on geographies consisting of 104,451,024 people shows a poor positive correlation between the proportion of Immigrants from Bahamas and unemployment rate among youth under the age of 25 in the United States with a correlation coefficient (R) of 0.196 and weighted average of 12.9%, a difference of 6.3%.
Unemployment Among Youth under 25 years Correlation Summary
| Measurement | Immigrants | Immigrants from Bahamas |
| Minimum | 0.10% | 0.60% |
| Maximum | 19.2% | 44.5% |
| Range | 19.1% | 43.9% |
| Mean | 11.5% | 14.1% |
| Median | 11.8% | 13.2% |
| Interquartile 25% (IQ1) | 10.7% | 11.1% |
| Interquartile 75% (IQ3) | 13.0% | 16.4% |
| Interquartile Range (IQR) | 2.3% | 5.3% |
| Standard Deviation (Sample) | 2.8% | 6.7% |
| Standard Deviation (Population) | 2.8% | 6.7% |
Similar Demographics by Unemployment Among Youth under 25 years
Demographics Similar to Immigrants by Unemployment Among Youth under 25 years
In terms of unemployment among youth under 25 years, the demographic groups most similar to Immigrants are Native Hawaiian (12.1%, a difference of 0.020%), Immigrants from Guatemala (12.1%, a difference of 0.040%), Guatemalan (12.1%, a difference of 0.060%), Albanian (12.1%, a difference of 0.090%), and Immigrants from Africa (12.1%, a difference of 0.14%).
| Demographics | Rating | Rank | Unemployment Among Youth under 25 years |
| Moroccans | 2.1 /100 | #229 | Tragic 12.1% |
| Choctaw | 1.9 /100 | #230 | Tragic 12.1% |
| Immigrants | South America | 1.8 /100 | #231 | Tragic 12.1% |
| Immigrants | Belarus | 1.6 /100 | #232 | Tragic 12.1% |
| South American Indians | 1.6 /100 | #233 | Tragic 12.1% |
| Guatemalans | 1.4 /100 | #234 | Tragic 12.1% |
| Immigrants | Guatemala | 1.4 /100 | #235 | Tragic 12.1% |
| Immigrants | Immigrants | 1.3 /100 | #236 | Tragic 12.1% |
| Native Hawaiians | 1.3 /100 | #237 | Tragic 12.1% |
| Albanians | 1.2 /100 | #238 | Tragic 12.1% |
| Immigrants | Africa | 1.1 /100 | #239 | Tragic 12.1% |
| Dutch West Indians | 1.1 /100 | #240 | Tragic 12.1% |
| Immigrants | Albania | 1.1 /100 | #241 | Tragic 12.1% |
| Immigrants | Western Asia | 0.8 /100 | #242 | Tragic 12.2% |
| Immigrants | Azores | 0.6 /100 | #243 | Tragic 12.2% |
Demographics Similar to Immigrants from Bahamas by Unemployment Among Youth under 25 years
In terms of unemployment among youth under 25 years, the demographic groups most similar to Immigrants from Bahamas are Cape Verdean (12.9%, a difference of 0.22%), Immigrants from Liberia (12.8%, a difference of 0.53%), Nigerian (13.0%, a difference of 0.57%), Immigrants from Nigeria (13.0%, a difference of 1.1%), and Bermudan (13.0%, a difference of 1.3%).
| Demographics | Rating | Rank | Unemployment Among Youth under 25 years |
| Puget Sound Salish | 0.1 /100 | #264 | Tragic 12.5% |
| Nepalese | 0.0 /100 | #265 | Tragic 12.5% |
| Immigrants | Latin America | 0.0 /100 | #266 | Tragic 12.6% |
| Sub-Saharan Africans | 0.0 /100 | #267 | Tragic 12.6% |
| Tlingit-Haida | 0.0 /100 | #268 | Tragic 12.7% |
| Kiowa | 0.0 /100 | #269 | Tragic 12.7% |
| Immigrants | Liberia | 0.0 /100 | #270 | Tragic 12.8% |
| Immigrants | Bahamas | 0.0 /100 | #271 | Tragic 12.9% |
| Cape Verdeans | 0.0 /100 | #272 | Tragic 12.9% |
| Nigerians | 0.0 /100 | #273 | Tragic 13.0% |
| Immigrants | Nigeria | 0.0 /100 | #274 | Tragic 13.0% |
| Bermudans | 0.0 /100 | #275 | Tragic 13.0% |
| Immigrants | Uzbekistan | 0.0 /100 | #276 | Tragic 13.1% |
| Bahamians | 0.0 /100 | #277 | Tragic 13.1% |
| Africans | 0.0 /100 | #278 | Tragic 13.2% |