Immigrants from Zimbabwe vs Immigrants from Austria Unemployment Among Ages 20 to 24 years

COMPARE

Immigrants from Zimbabwe
Race
Ancestry
AfghanAfricanAlaska NativeAlaskan AthabascanAlbanianAleutAlsatianAmericanApacheArabArapahoArgentineanArmenianAssyrian/Chaldean/SyriacAustralianAustrianBahamianBangladeshiBarbadianBasqueBelgianBelizeanBermudanBhutaneseBlackfeetBolivianBrazilianBritishBritish West IndianBulgarianBurmeseCajunCambodianCanadianCape VerdeanCarpatho RusynCelticCentral AmericanCentral American IndianCherokeeCheyenneChickasawChileanChineseChippewaChoctawColombianColvilleComancheCosta RicanCreeCreekCroatianCrowCubanCypriotCzechCzechoslovakianDanishDelawareDominicanDutchDutch West IndianEastern EuropeanEcuadorianEgyptianEnglishEstonianEthiopianEuropeanFijianFilipinoFinnishFrenchFrench American IndianFrench CanadianGermanGerman RussianGhanaianGreekGuamanian/ChamorroGuatemalanGuyaneseHaitianHmongHonduranHopiHoumaHungarianIcelanderIndian (Asian)IndonesianInupiatIranianIraqiIrishIroquoisIsraeliItalianJamaicanJapaneseJordanianKenyanKiowaKoreanLaotianLatvianLebaneseLiberianLithuanianLumbeeLuxembourgerMacedonianMalaysianMalteseMarshalleseMenomineeMexicanMexican American IndianMongolianMoroccanNative HawaiianNavajoNepaleseNew ZealanderNicaraguanNigerianNorthern EuropeanNorwegianOkinawanOsageOttawaPaiutePakistaniPalestinianPanamanianParaguayanPennsylvania GermanPeruvianPimaPolishPortuguesePotawatomiPuebloPuerto RicanPuget Sound SalishRomanianRussianSalvadoranSamoanScandinavianScotch-IrishScottishSeminoleSenegaleseSerbianShoshoneSierra LeoneanSiouxSlavicSlovakSloveneSomaliSouth AfricanSouth AmericanSouth American IndianSoviet UnionSpaniardSpanishSpanish AmericanSpanish American IndianSri LankanSubsaharan AfricanSudaneseSwedishSwissSyrianTaiwaneseThaiTlingit-HaidaTohono O'OdhamTonganTrinidadian and TobagonianTsimshianTurkishU.S. Virgin IslanderUgandanUkrainianUruguayanUteVenezuelanVietnameseWelshWest IndianYakamaYaquiYugoslavianYumanYup'ikZimbabwean
Immigration
NonimmigrantsImmigrantsAfghanistanAfricaAlbaniaArgentinaArmeniaAsiaAustraliaBahamasBangladeshBarbadosBelarusBelgiumBelizeBoliviaBosnia and HerzegovinaBrazilBulgariaBurma/MyanmarCabo VerdeCambodiaCameroonCanadaCaribbeanCentral AmericaChileChinaColombiaCongoCosta RicaCroatiaCubaCzechoslovakiaDenmarkDominicaDominican RepublicEastern AfricaEastern AsiaEastern EuropeEcuadorEgyptEl SalvadorEnglandEritreaEthiopiaEuropeFijiFranceGermanyGhanaGreeceGrenadaGuatemalaGuyanaHaitiHondurasHong KongHungaryIndiaIndonesiaIranIraqIrelandIsraelItalyJamaicaJapanJordanKazakhstanKenyaKoreaKuwaitLaosLatin AmericaLatviaLebanonLiberiaLithuaniaMalaysiaMexicoMicronesiaMiddle AfricaMoldovaMoroccoNepalNetherlandsNicaraguaNigeriaNorth AmericaNorth MacedoniaNorthern AfricaNorthern EuropeNorwayOceaniaPakistanPanamaPeruPhilippinesPolandPortugalRomaniaRussiaSaudi ArabiaScotlandSenegalSerbiaSierra LeoneSingaporeSomaliaSouth AfricaSouth AmericaSouth Central AsiaSouth Eastern AsiaSouthern EuropeSpainSri LankaSt. Vincent and the GrenadinesSudanSwedenSwitzerlandSyriaTaiwanThailandTrinidad and TobagoTurkeyUgandaUkraineUruguayUzbekistanVenezuelaVietnamWest IndiesWestern AfricaWestern AsiaWestern EuropeYemenZaireZimbabweAzores
Immigrants from Austria
Race
Ancestry
AfghanAfricanAlaska NativeAlaskan AthabascanAlbanianAleutAlsatianAmericanApacheArabArapahoArgentineanArmenianAssyrian/Chaldean/SyriacAustralianAustrianBahamianBangladeshiBarbadianBasqueBelgianBelizeanBermudanBhutaneseBlackfeetBolivianBrazilianBritishBritish West IndianBulgarianBurmeseCajunCambodianCanadianCape VerdeanCarpatho RusynCelticCentral AmericanCentral American IndianCherokeeCheyenneChickasawChileanChineseChippewaChoctawColombianColvilleComancheCosta RicanCreeCreekCroatianCrowCubanCypriotCzechCzechoslovakianDanishDelawareDominicanDutchDutch West IndianEastern EuropeanEcuadorianEgyptianEnglishEstonianEthiopianEuropeanFijianFilipinoFinnishFrenchFrench American IndianFrench CanadianGermanGerman RussianGhanaianGreekGuamanian/ChamorroGuatemalanGuyaneseHaitianHmongHonduranHopiHoumaHungarianIcelanderIndian (Asian)IndonesianInupiatIranianIraqiIrishIroquoisIsraeliItalianJamaicanJapaneseJordanianKenyanKiowaKoreanLaotianLatvianLebaneseLiberianLithuanianLumbeeLuxembourgerMacedonianMalaysianMalteseMarshalleseMenomineeMexicanMexican American IndianMongolianMoroccanNative HawaiianNavajoNepaleseNew ZealanderNicaraguanNigerianNorthern EuropeanNorwegianOkinawanOsageOttawaPaiutePakistaniPalestinianPanamanianParaguayanPennsylvania GermanPeruvianPimaPolishPortuguesePotawatomiPuebloPuerto RicanPuget Sound SalishRomanianRussianSalvadoranSamoanScandinavianScotch-IrishScottishSeminoleSenegaleseSerbianShoshoneSierra LeoneanSiouxSlavicSlovakSloveneSomaliSouth AfricanSouth AmericanSouth American IndianSoviet UnionSpaniardSpanishSpanish AmericanSpanish American IndianSri LankanSubsaharan AfricanSudaneseSwedishSwissSyrianTaiwaneseThaiTlingit-HaidaTohono O'OdhamTonganTrinidadian and TobagonianTsimshianTurkishU.S. Virgin IslanderUgandanUkrainianUruguayanUteVenezuelanVietnameseWelshWest IndianYakamaYaquiYugoslavianYumanYup'ikZimbabwean
Immigration
NonimmigrantsImmigrantsAfghanistanAfricaAlbaniaArgentinaArmeniaAsiaAustraliaAustriaBahamasBangladeshBarbadosBelarusBelgiumBelizeBoliviaBosnia and HerzegovinaBrazilBulgariaBurma/MyanmarCabo VerdeCambodiaCameroonCanadaCaribbeanCentral AmericaChileChinaColombiaCongoCosta RicaCroatiaCubaCzechoslovakiaDenmarkDominicaDominican RepublicEastern AfricaEastern AsiaEastern EuropeEcuadorEgyptEl SalvadorEnglandEritreaEthiopiaEuropeFijiFranceGermanyGhanaGreeceGrenadaGuatemalaGuyanaHaitiHondurasHong KongHungaryIndiaIndonesiaIranIraqIrelandIsraelItalyJamaicaJapanJordanKazakhstanKenyaKoreaKuwaitLaosLatin AmericaLatviaLebanonLiberiaLithuaniaMalaysiaMexicoMicronesiaMiddle AfricaMoldovaMoroccoNepalNetherlandsNicaraguaNigeriaNorth AmericaNorth MacedoniaNorthern AfricaNorthern EuropeNorwayOceaniaPakistanPanamaPeruPhilippinesPolandPortugalRomaniaRussiaSaudi ArabiaScotlandSenegalSerbiaSierra LeoneSingaporeSomaliaSouth AfricaSouth AmericaSouth Central AsiaSouth Eastern AsiaSouthern EuropeSpainSri LankaSt. Vincent and the GrenadinesSudanSwedenSwitzerlandSyriaTaiwanThailandTrinidad and TobagoTurkeyUgandaUkraineUruguayUzbekistanVenezuelaVietnamWest IndiesWestern AfricaWestern AsiaWestern EuropeYemenZaireAzores
Unemployment Among Ages 20 to 24 years
Income
Poverty
Unemployment
Labor Participation
Family Structure
Vehicle Availability
Education Level
Disability

Unemployment Among Ages 20 to 24 years Comparison

Immigrants from Zimbabwe

Immigrants from Austria

Exceptional
Excellent
9.5%
UNEMPLOYMENT AMONG AGES 20 TO 24 YEARS
100.0/ 100
METRIC RATING
27th/ 347
METRIC RANK
10.2%
UNEMPLOYMENT AMONG AGES 20 TO 24 YEARS
81.4/ 100
METRIC RATING
140th/ 347
METRIC RANK

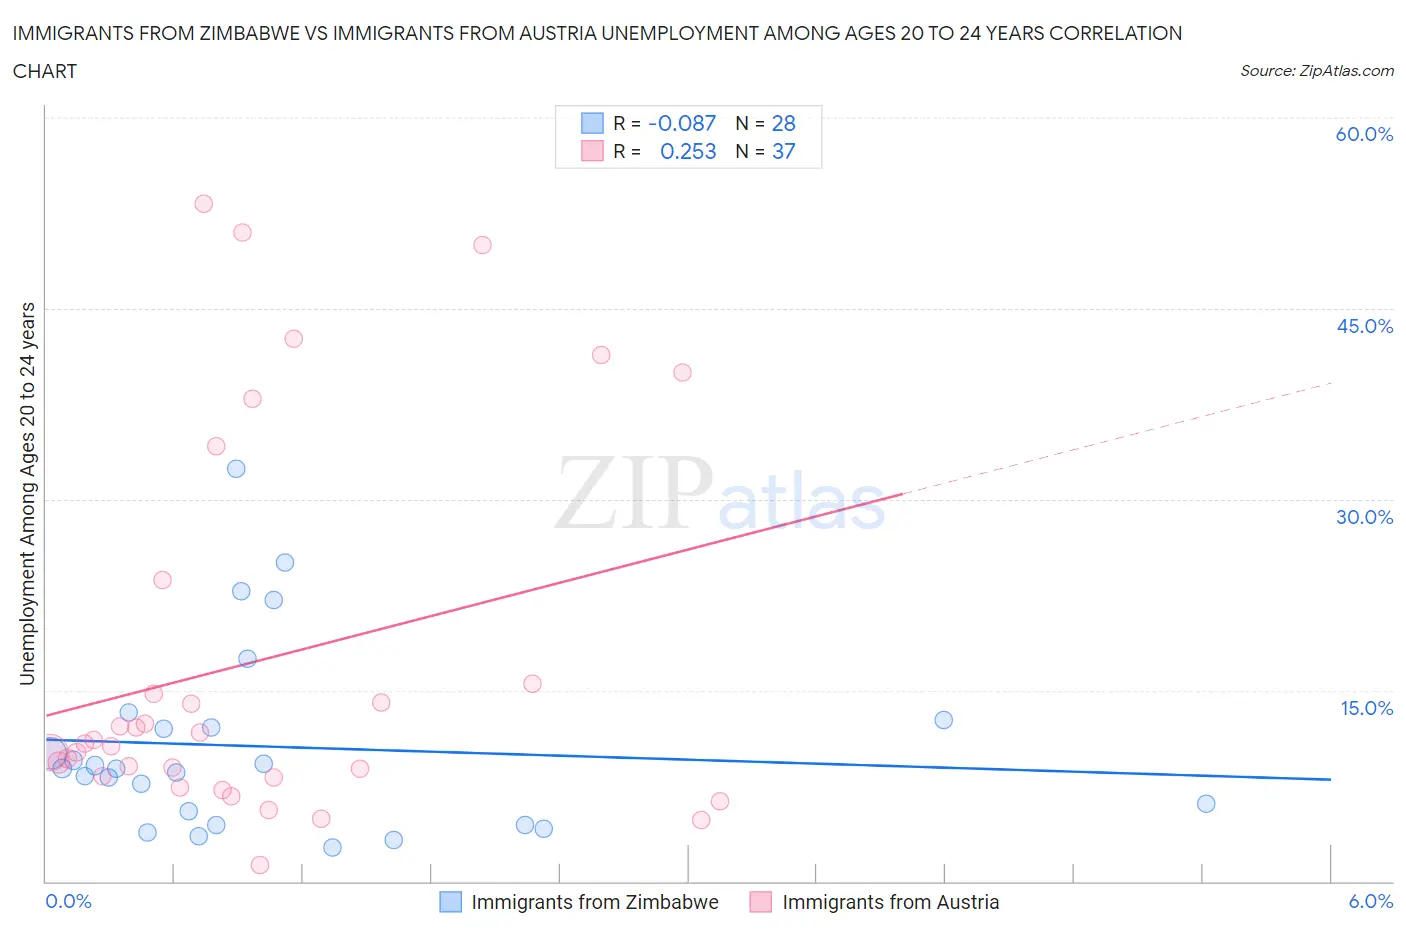
Immigrants from Zimbabwe vs Immigrants from Austria Unemployment Among Ages 20 to 24 years Correlation Chart

The statistical analysis conducted on geographies consisting of 116,782,368 people shows a slight negative correlation between the proportion of Immigrants from Zimbabwe and unemployment rate among population between the ages 20 and 24 in the United States with a correlation coefficient (R) of -0.087 and weighted average of 9.5%. Similarly, the statistical analysis conducted on geographies consisting of 165,080,210 people shows a weak positive correlation between the proportion of Immigrants from Austria and unemployment rate among population between the ages 20 and 24 in the United States with a correlation coefficient (R) of 0.253 and weighted average of 10.2%, a difference of 6.8%.
Immigrants from Zimbabwe vs Immigrants from Austria Unemployment Among Ages 20 to 24 years

Unemployment Among Ages 20 to 24 years Correlation Summary

MeasurementImmigrants from ZimbabweImmigrants from Austria
Minimum2.6%1.2%
Maximum32.4%53.2%
Range29.8%52.0%
Mean10.6%17.3%
Median8.9%10.8%
Interquartile 25% (IQ1)5.0%8.2%
Interquartile 75% (IQ3)12.4%19.6%
Interquartile Range (IQR)7.4%11.3%
Standard Deviation (Sample)7.3%14.9%
Standard Deviation (Population)7.2%14.7%

Similar Demographics by Unemployment Among Ages 20 to 24 years

Demographics Similar to Immigrants from Zimbabwe by Unemployment Among Ages 20 to 24 years

In terms of unemployment among ages 20 to 24 years, the demographic groups most similar to Immigrants from Zimbabwe are Immigrants from Afghanistan (9.5%, a difference of 0.080%), Immigrants from North Macedonia (9.5%, a difference of 0.090%), Scandinavian (9.5%, a difference of 0.11%), Immigrants from Eastern Africa (9.5%, a difference of 0.19%), and Cambodian (9.5%, a difference of 0.24%).
DemographicsRating | RankUnemployment Among Ages 20 to 24 years
Osage
100.0
/100
|
#20
Exceptional
9.4%
Immigrants | Bosnia and Herzegovina
100.0
/100
|
#21
Exceptional
9.4%
Tongans
100.0
/100
|
#22
Exceptional
9.4%
Immigrants | Nepal
100.0
/100
|
#23
Exceptional
9.4%
Taiwanese
100.0
/100
|
#24
Exceptional
9.4%
Immigrants | Eritrea
100.0
/100
|
#25
Exceptional
9.5%
Swedes
100.0
/100
|
#26
Exceptional
9.5%
Immigrants | Zimbabwe
100.0
/100
|
#27
Exceptional
9.5%
Immigrants | Afghanistan
100.0
/100
|
#28
Exceptional
9.5%
Immigrants | North Macedonia
100.0
/100
|
#29
Exceptional
9.5%
Scandinavians
100.0
/100
|
#30
Exceptional
9.5%
Immigrants | Eastern Africa
100.0
/100
|
#31
Exceptional
9.5%
Cambodians
100.0
/100
|
#32
Exceptional
9.5%
Australians
100.0
/100
|
#33
Exceptional
9.6%
Yugoslavians
100.0
/100
|
#34
Exceptional
9.6%

Demographics Similar to Immigrants from Austria by Unemployment Among Ages 20 to 24 years

In terms of unemployment among ages 20 to 24 years, the demographic groups most similar to Immigrants from Austria are Immigrants from the Azores (10.2%, a difference of 0.0%), Uruguayan (10.2%, a difference of 0.030%), Burmese (10.2%, a difference of 0.060%), Immigrants from Northern Africa (10.2%, a difference of 0.070%), and Immigrants from North America (10.2%, a difference of 0.070%).
DemographicsRating | RankUnemployment Among Ages 20 to 24 years
Austrians
83.9
/100
|
#133
Excellent
10.2%
Romanians
83.8
/100
|
#134
Excellent
10.2%
Comanche
83.4
/100
|
#135
Excellent
10.2%
Immigrants | Northern Africa
82.5
/100
|
#136
Excellent
10.2%
Immigrants | North America
82.5
/100
|
#137
Excellent
10.2%
Burmese
82.3
/100
|
#138
Excellent
10.2%
Uruguayans
81.9
/100
|
#139
Excellent
10.2%
Immigrants | Austria
81.4
/100
|
#140
Excellent
10.2%
Immigrants | Azores
81.4
/100
|
#141
Excellent
10.2%
Slovaks
80.2
/100
|
#142
Excellent
10.2%
Immigrants | Jordan
79.0
/100
|
#143
Good
10.2%
Brazilians
78.4
/100
|
#144
Good
10.2%
Argentineans
78.0
/100
|
#145
Good
10.2%
Asians
77.7
/100
|
#146
Good
10.2%
French Canadians
77.5
/100
|
#147
Good
10.2%