Immigrants from Zaire vs Czechoslovakian Unemployment Among Women with Children Under 18 years

COMPARE

Immigrants from Zaire
Race
Ancestry
AfghanAfricanAlaska NativeAlaskan AthabascanAlbanianAleutAlsatianAmericanApacheArabArapahoArgentineanArmenianAssyrian/Chaldean/SyriacAustralianAustrianBahamianBangladeshiBarbadianBasqueBelgianBelizeanBermudanBhutaneseBlackfeetBolivianBrazilianBritishBritish West IndianBulgarianBurmeseCajunCambodianCanadianCape VerdeanCarpatho RusynCelticCentral AmericanCentral American IndianCherokeeCheyenneChickasawChileanChineseChippewaChoctawColombianColvilleComancheCosta RicanCreeCreekCroatianCrowCubanCypriotCzechDanishDelawareDominicanDutchDutch West IndianEastern EuropeanEcuadorianEgyptianEnglishEstonianEthiopianEuropeanFijianFilipinoFinnishFrenchFrench American IndianFrench CanadianGermanGerman RussianGhanaianGreekGuamanian/ChamorroGuatemalanGuyaneseHaitianHmongHonduranHopiHoumaHungarianIcelanderIndian (Asian)IndonesianInupiatIranianIraqiIrishIroquoisIsraeliItalianJamaicanJapaneseJordanianKenyanKiowaKoreanLaotianLatvianLebaneseLiberianLithuanianLumbeeLuxembourgerMacedonianMalaysianMalteseMarshalleseMenomineeMexicanMexican American IndianMongolianMoroccanNative HawaiianNavajoNepaleseNew ZealanderNicaraguanNigerianNorthern EuropeanNorwegianOkinawanOsageOttawaPaiutePakistaniPalestinianPanamanianParaguayanPennsylvania GermanPeruvianPimaPolishPortuguesePotawatomiPuebloPuerto RicanPuget Sound SalishRomanianRussianSalvadoranSamoanScandinavianScotch-IrishScottishSeminoleSenegaleseSerbianShoshoneSierra LeoneanSiouxSlavicSlovakSloveneSomaliSouth AfricanSouth AmericanSouth American IndianSoviet UnionSpaniardSpanishSpanish AmericanSpanish American IndianSri LankanSubsaharan AfricanSudaneseSwedishSwissSyrianTaiwaneseThaiTlingit-HaidaTohono O'OdhamTonganTrinidadian and TobagonianTsimshianTurkishU.S. Virgin IslanderUgandanUkrainianUruguayanUteVenezuelanVietnameseWelshWest IndianYakamaYaquiYugoslavianYumanYup'ikZimbabwean
Immigration
NonimmigrantsImmigrantsAfghanistanAfricaAlbaniaArgentinaArmeniaAsiaAustraliaAustriaBahamasBangladeshBarbadosBelarusBelgiumBelizeBoliviaBosnia and HerzegovinaBrazilBulgariaBurma/MyanmarCabo VerdeCambodiaCameroonCanadaCaribbeanCentral AmericaChileChinaColombiaCongoCosta RicaCroatiaCubaCzechoslovakiaDenmarkDominicaDominican RepublicEastern AfricaEastern AsiaEastern EuropeEcuadorEgyptEl SalvadorEnglandEritreaEthiopiaEuropeFijiFranceGermanyGhanaGreeceGrenadaGuatemalaGuyanaHaitiHondurasHong KongHungaryIndiaIndonesiaIranIraqIrelandIsraelItalyJamaicaJapanJordanKazakhstanKenyaKoreaKuwaitLaosLatin AmericaLatviaLebanonLiberiaLithuaniaMalaysiaMexicoMicronesiaMiddle AfricaMoldovaMoroccoNepalNetherlandsNicaraguaNigeriaNorth AmericaNorth MacedoniaNorthern AfricaNorthern EuropeNorwayOceaniaPakistanPanamaPeruPhilippinesPolandPortugalRomaniaRussiaSaudi ArabiaScotlandSenegalSerbiaSierra LeoneSingaporeSomaliaSouth AfricaSouth AmericaSouth Central AsiaSouth Eastern AsiaSouthern EuropeSpainSri LankaSt. Vincent and the GrenadinesSudanSwedenSwitzerlandSyriaTaiwanThailandTrinidad and TobagoTurkeyUgandaUkraineUruguayUzbekistanVenezuelaVietnamWest IndiesWestern AfricaWestern AsiaWestern EuropeYemenZaireZimbabweAzores
Czechoslovakian
Race
Ancestry
AfghanAfricanAlaska NativeAlaskan AthabascanAlbanianAleutAlsatianAmericanApacheArabArapahoArgentineanArmenianAssyrian/Chaldean/SyriacAustralianAustrianBahamianBangladeshiBarbadianBasqueBelgianBelizeanBermudanBhutaneseBlackfeetBolivianBrazilianBritishBritish West IndianBulgarianBurmeseCajunCambodianCanadianCape VerdeanCarpatho RusynCelticCentral AmericanCentral American IndianCherokeeCheyenneChickasawChileanChineseChippewaChoctawColombianColvilleComancheCosta RicanCreeCreekCroatianCrowCubanCypriotCzechCzechoslovakianDanishDelawareDominicanDutchDutch West IndianEastern EuropeanEcuadorianEgyptianEnglishEstonianEthiopianEuropeanFijianFilipinoFinnishFrenchFrench American IndianFrench CanadianGermanGerman RussianGhanaianGreekGuamanian/ChamorroGuatemalanGuyaneseHaitianHmongHonduranHopiHoumaHungarianIcelanderIndian (Asian)IndonesianInupiatIranianIraqiIrishIroquoisIsraeliItalianJamaicanJapaneseJordanianKenyanKiowaKoreanLaotianLatvianLebaneseLiberianLithuanianLumbeeLuxembourgerMacedonianMalaysianMalteseMarshalleseMenomineeMexicanMexican American IndianMongolianMoroccanNative HawaiianNavajoNepaleseNew ZealanderNicaraguanNigerianNorthern EuropeanNorwegianOkinawanOsageOttawaPaiutePakistaniPalestinianPanamanianParaguayanPennsylvania GermanPeruvianPimaPolishPortuguesePotawatomiPuebloPuerto RicanPuget Sound SalishRomanianRussianSalvadoranSamoanScandinavianScotch-IrishScottishSeminoleSenegaleseSerbianShoshoneSierra LeoneanSiouxSlavicSlovakSloveneSomaliSouth AfricanSouth AmericanSouth American IndianSoviet UnionSpaniardSpanishSpanish AmericanSpanish American IndianSri LankanSubsaharan AfricanSudaneseSwedishSwissSyrianTaiwaneseThaiTlingit-HaidaTohono O'OdhamTonganTrinidadian and TobagonianTsimshianTurkishU.S. Virgin IslanderUgandanUkrainianUruguayanUteVenezuelanVietnameseWelshWest IndianYakamaYaquiYugoslavianYumanYup'ikZimbabwean
Immigration
NonimmigrantsImmigrantsAfghanistanAfricaAlbaniaArgentinaArmeniaAsiaAustraliaAustriaBahamasBangladeshBarbadosBelarusBelgiumBelizeBoliviaBosnia and HerzegovinaBrazilBulgariaBurma/MyanmarCabo VerdeCambodiaCameroonCanadaCaribbeanCentral AmericaChileChinaColombiaCongoCosta RicaCroatiaCubaCzechoslovakiaDenmarkDominicaDominican RepublicEastern AfricaEastern AsiaEastern EuropeEcuadorEgyptEl SalvadorEnglandEritreaEthiopiaEuropeFijiFranceGermanyGhanaGreeceGrenadaGuatemalaGuyanaHaitiHondurasHong KongHungaryIndiaIndonesiaIranIraqIrelandIsraelItalyJamaicaJapanJordanKazakhstanKenyaKoreaKuwaitLaosLatin AmericaLatviaLebanonLiberiaLithuaniaMalaysiaMexicoMicronesiaMiddle AfricaMoldovaMoroccoNepalNetherlandsNicaraguaNigeriaNorth AmericaNorth MacedoniaNorthern AfricaNorthern EuropeNorwayOceaniaPakistanPanamaPeruPhilippinesPolandPortugalRomaniaRussiaSaudi ArabiaScotlandSenegalSerbiaSierra LeoneSingaporeSomaliaSouth AfricaSouth AmericaSouth Central AsiaSouth Eastern AsiaSouthern EuropeSpainSri LankaSt. Vincent and the GrenadinesSudanSwedenSwitzerlandSyriaTaiwanThailandTrinidad and TobagoTurkeyUgandaUkraineUruguayUzbekistanVenezuelaVietnamWest IndiesWestern AfricaWestern AsiaWestern EuropeYemenZimbabweAzores
Unemployment Among Women with Children Under 18 years
Income
Poverty
Unemployment
Labor Participation
Family Structure
Vehicle Availability
Education Level
Disability

Unemployment Among Women with Children Under 18 years Comparison

Immigrants from Zaire

Czechoslovakians

Fair
Exceptional
5.5%
UNEMPLOYMENT AMONG WOMEN WITH CHILDREN UNDER 18 YEARS
38.1/ 100
METRIC RATING
185th/ 347
METRIC RANK
5.1%
UNEMPLOYMENT AMONG WOMEN WITH CHILDREN UNDER 18 YEARS
98.0/ 100
METRIC RATING
57th/ 347
METRIC RANK

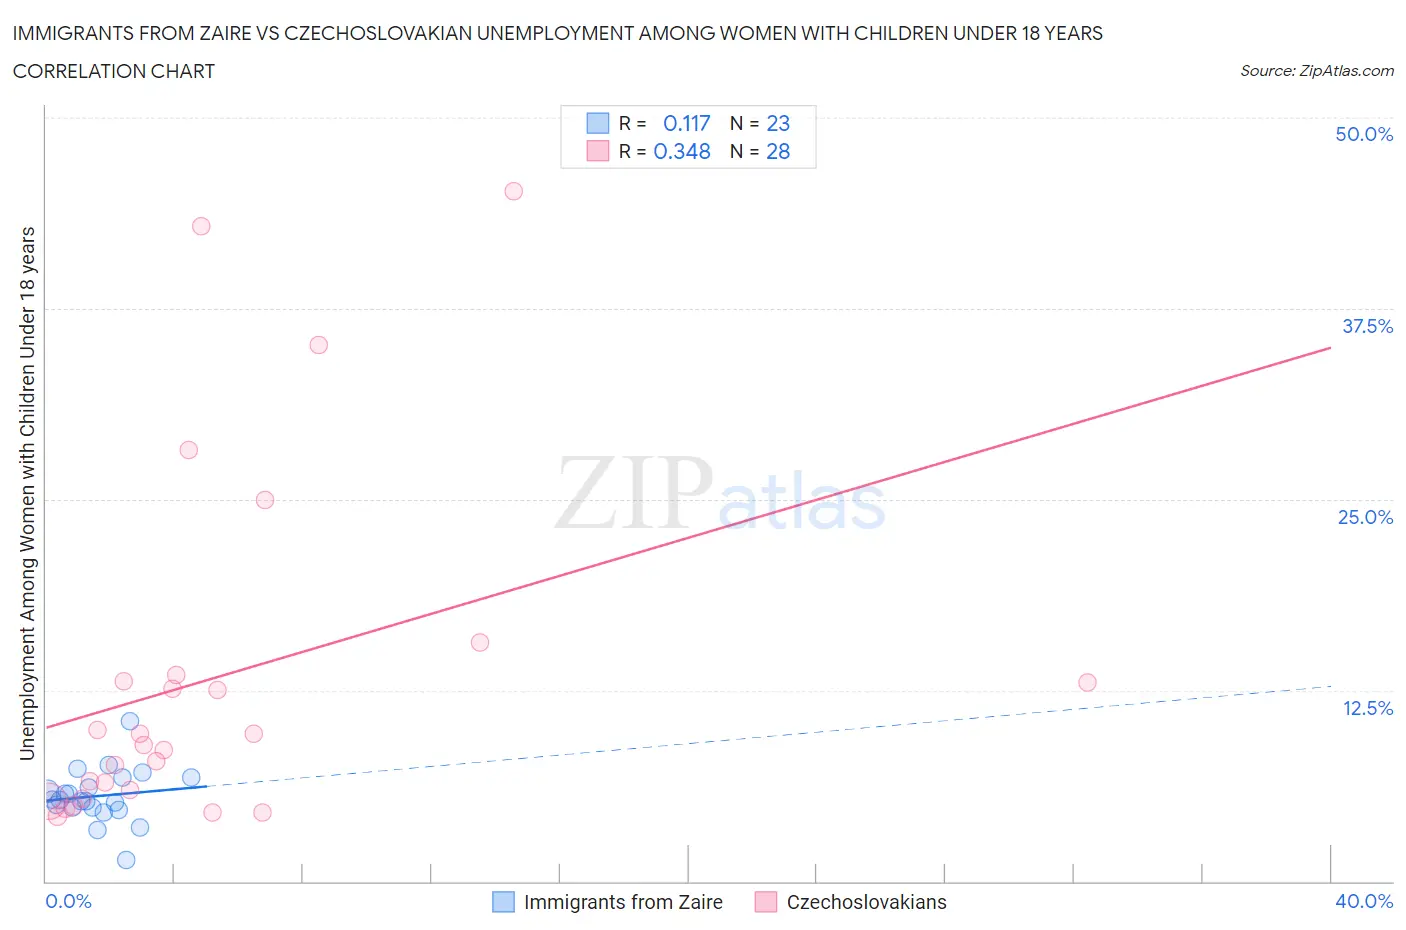
Immigrants from Zaire vs Czechoslovakian Unemployment Among Women with Children Under 18 years Correlation Chart

The statistical analysis conducted on geographies consisting of 106,212,283 people shows a poor positive correlation between the proportion of Immigrants from Zaire and unemployment rate among women with children under the age of 18 in the United States with a correlation coefficient (R) of 0.117 and weighted average of 5.5%. Similarly, the statistical analysis conducted on geographies consisting of 349,944,038 people shows a mild positive correlation between the proportion of Czechoslovakians and unemployment rate among women with children under the age of 18 in the United States with a correlation coefficient (R) of 0.348 and weighted average of 5.1%, a difference of 8.3%.
Immigrants from Zaire vs Czechoslovakian Unemployment Among Women with Children Under 18 years

Unemployment Among Women with Children Under 18 years Correlation Summary

MeasurementImmigrants from ZaireCzechoslovakian
Minimum1.4%4.3%
Maximum10.5%45.2%
Range9.1%40.9%
Mean5.6%13.3%
Median5.3%9.3%
Interquartile 25% (IQ1)4.8%5.7%
Interquartile 75% (IQ3)6.8%13.3%
Interquartile Range (IQR)1.9%7.6%
Standard Deviation (Sample)1.7%11.4%
Standard Deviation (Population)1.7%11.2%

Similar Demographics by Unemployment Among Women with Children Under 18 years

Demographics Similar to Immigrants from Zaire by Unemployment Among Women with Children Under 18 years

In terms of unemployment among women with children under 18 years, the demographic groups most similar to Immigrants from Zaire are Immigrants from Cambodia (5.5%, a difference of 0.020%), Immigrants from Laos (5.5%, a difference of 0.050%), Indonesian (5.5%, a difference of 0.13%), Malaysian (5.5%, a difference of 0.18%), and Immigrants from Sudan (5.5%, a difference of 0.19%).
DemographicsRating | RankUnemployment Among Women with Children Under 18 years
Costa Ricans
45.2
/100
|
#178
Average
5.5%
Syrians
42.8
/100
|
#179
Average
5.5%
Immigrants | Southern Europe
42.7
/100
|
#180
Average
5.5%
Immigrants | Hungary
41.3
/100
|
#181
Average
5.5%
Immigrants | Sudan
40.6
/100
|
#182
Average
5.5%
Immigrants | Laos
38.8
/100
|
#183
Fair
5.5%
Immigrants | Cambodia
38.4
/100
|
#184
Fair
5.5%
Immigrants | Zaire
38.1
/100
|
#185
Fair
5.5%
Indonesians
36.3
/100
|
#186
Fair
5.5%
Malaysians
35.7
/100
|
#187
Fair
5.5%
Iraqis
35.3
/100
|
#188
Fair
5.5%
Immigrants | Eritrea
33.8
/100
|
#189
Fair
5.5%
Immigrants | Poland
31.2
/100
|
#190
Fair
5.5%
South American Indians
30.8
/100
|
#191
Fair
5.5%
Immigrants | Spain
30.7
/100
|
#192
Fair
5.5%

Demographics Similar to Czechoslovakians by Unemployment Among Women with Children Under 18 years

In terms of unemployment among women with children under 18 years, the demographic groups most similar to Czechoslovakians are Immigrants from Ireland (5.1%, a difference of 0.050%), Immigrants from Belgium (5.1%, a difference of 0.080%), Immigrants from Sri Lanka (5.1%, a difference of 0.090%), Asian (5.1%, a difference of 0.10%), and Immigrants from Serbia (5.1%, a difference of 0.23%).
DemographicsRating | RankUnemployment Among Women with Children Under 18 years
Immigrants | Japan
98.4
/100
|
#50
Exceptional
5.0%
Yugoslavians
98.3
/100
|
#51
Exceptional
5.1%
Immigrants | Nepal
98.3
/100
|
#52
Exceptional
5.1%
Scottish
98.2
/100
|
#53
Exceptional
5.1%
Immigrants | Serbia
98.2
/100
|
#54
Exceptional
5.1%
Immigrants | Sri Lanka
98.1
/100
|
#55
Exceptional
5.1%
Immigrants | Ireland
98.0
/100
|
#56
Exceptional
5.1%
Czechoslovakians
98.0
/100
|
#57
Exceptional
5.1%
Immigrants | Belgium
97.9
/100
|
#58
Exceptional
5.1%
Asians
97.9
/100
|
#59
Exceptional
5.1%
Welsh
97.7
/100
|
#60
Exceptional
5.1%
Russians
97.5
/100
|
#61
Exceptional
5.1%
Immigrants | Bulgaria
97.4
/100
|
#62
Exceptional
5.1%
Italians
97.4
/100
|
#63
Exceptional
5.1%
Estonians
97.2
/100
|
#64
Exceptional
5.1%