Immigrants from Yemen vs Scotch-Irish Unemployment Among Ages 20 to 24 years

COMPARE

Immigrants from Yemen
Race
Ancestry
AfghanAfricanAlaska NativeAlaskan AthabascanAlbanianAleutAlsatianAmericanApacheArabArapahoArgentineanArmenianAssyrian/Chaldean/SyriacAustralianAustrianBahamianBangladeshiBarbadianBasqueBelgianBelizeanBermudanBhutaneseBlackfeetBolivianBrazilianBritishBritish West IndianBulgarianBurmeseCajunCambodianCanadianCape VerdeanCarpatho RusynCelticCentral AmericanCentral American IndianCherokeeCheyenneChickasawChileanChineseChippewaChoctawColombianColvilleComancheCosta RicanCreeCreekCroatianCrowCubanCypriotCzechCzechoslovakianDanishDelawareDominicanDutchDutch West IndianEastern EuropeanEcuadorianEgyptianEnglishEstonianEthiopianEuropeanFijianFilipinoFinnishFrenchFrench American IndianFrench CanadianGermanGerman RussianGhanaianGreekGuamanian/ChamorroGuatemalanGuyaneseHaitianHmongHonduranHopiHoumaHungarianIcelanderIndian (Asian)IndonesianInupiatIranianIraqiIrishIroquoisIsraeliItalianJamaicanJapaneseJordanianKenyanKiowaKoreanLaotianLatvianLebaneseLiberianLithuanianLumbeeLuxembourgerMacedonianMalaysianMalteseMarshalleseMenomineeMexicanMexican American IndianMongolianMoroccanNative HawaiianNavajoNepaleseNew ZealanderNicaraguanNigerianNorthern EuropeanNorwegianOkinawanOsageOttawaPaiutePakistaniPalestinianPanamanianParaguayanPennsylvania GermanPeruvianPimaPolishPortuguesePotawatomiPuebloPuerto RicanPuget Sound SalishRomanianRussianSalvadoranSamoanScandinavianScottishSeminoleSenegaleseSerbianShoshoneSierra LeoneanSiouxSlavicSlovakSloveneSomaliSouth AfricanSouth AmericanSouth American IndianSoviet UnionSpaniardSpanishSpanish AmericanSpanish American IndianSri LankanSubsaharan AfricanSudaneseSwedishSwissSyrianTaiwaneseThaiTlingit-HaidaTohono O'OdhamTonganTrinidadian and TobagonianTsimshianTurkishU.S. Virgin IslanderUgandanUkrainianUruguayanUteVenezuelanVietnameseWelshWest IndianYakamaYaquiYugoslavianYumanYup'ikZimbabwean
Immigration
NonimmigrantsImmigrantsAfghanistanAfricaAlbaniaArgentinaArmeniaAsiaAustraliaAustriaBahamasBangladeshBarbadosBelarusBelgiumBelizeBoliviaBosnia and HerzegovinaBrazilBulgariaBurma/MyanmarCabo VerdeCambodiaCameroonCanadaCaribbeanCentral AmericaChileChinaColombiaCongoCosta RicaCroatiaCubaCzechoslovakiaDenmarkDominicaDominican RepublicEastern AfricaEastern AsiaEastern EuropeEcuadorEgyptEl SalvadorEnglandEritreaEthiopiaEuropeFijiFranceGermanyGhanaGreeceGrenadaGuatemalaGuyanaHaitiHondurasHong KongHungaryIndiaIndonesiaIranIraqIrelandIsraelItalyJamaicaJapanJordanKazakhstanKenyaKoreaKuwaitLaosLatin AmericaLatviaLebanonLiberiaLithuaniaMalaysiaMexicoMicronesiaMiddle AfricaMoldovaMoroccoNepalNetherlandsNicaraguaNigeriaNorth AmericaNorth MacedoniaNorthern AfricaNorthern EuropeNorwayOceaniaPakistanPanamaPeruPhilippinesPolandPortugalRomaniaRussiaSaudi ArabiaScotlandSenegalSerbiaSierra LeoneSingaporeSomaliaSouth AfricaSouth AmericaSouth Central AsiaSouth Eastern AsiaSouthern EuropeSpainSri LankaSt. Vincent and the GrenadinesSudanSwedenSwitzerlandSyriaTaiwanThailandTrinidad and TobagoTurkeyUgandaUkraineUruguayUzbekistanVenezuelaVietnamWest IndiesWestern AfricaWestern AsiaWestern EuropeYemenZaireZimbabweAzores
Scotch-Irish
Race
Ancestry
AfghanAfricanAlaska NativeAlaskan AthabascanAlbanianAleutAlsatianAmericanApacheArabArapahoArgentineanArmenianAssyrian/Chaldean/SyriacAustralianAustrianBahamianBangladeshiBarbadianBasqueBelgianBelizeanBermudanBhutaneseBlackfeetBolivianBrazilianBritishBritish West IndianBulgarianBurmeseCajunCambodianCanadianCape VerdeanCarpatho RusynCelticCentral AmericanCentral American IndianCherokeeCheyenneChickasawChileanChineseChippewaChoctawColombianColvilleComancheCosta RicanCreeCreekCroatianCrowCubanCypriotCzechCzechoslovakianDanishDelawareDominicanDutchDutch West IndianEastern EuropeanEcuadorianEgyptianEnglishEstonianEthiopianEuropeanFijianFilipinoFinnishFrenchFrench American IndianFrench CanadianGermanGerman RussianGhanaianGreekGuamanian/ChamorroGuatemalanGuyaneseHaitianHmongHonduranHopiHoumaHungarianIcelanderIndian (Asian)IndonesianInupiatIranianIraqiIrishIroquoisIsraeliItalianJamaicanJapaneseJordanianKenyanKiowaKoreanLaotianLatvianLebaneseLiberianLithuanianLumbeeLuxembourgerMacedonianMalaysianMalteseMarshalleseMenomineeMexicanMexican American IndianMongolianMoroccanNative HawaiianNavajoNepaleseNew ZealanderNicaraguanNigerianNorthern EuropeanNorwegianOkinawanOsageOttawaPaiutePakistaniPalestinianPanamanianParaguayanPennsylvania GermanPeruvianPimaPolishPortuguesePotawatomiPuebloPuerto RicanPuget Sound SalishRomanianRussianSalvadoranSamoanScandinavianScotch-IrishScottishSeminoleSenegaleseSerbianShoshoneSierra LeoneanSiouxSlavicSlovakSloveneSomaliSouth AfricanSouth AmericanSouth American IndianSoviet UnionSpaniardSpanishSpanish AmericanSpanish American IndianSri LankanSubsaharan AfricanSudaneseSwedishSwissSyrianTaiwaneseThaiTlingit-HaidaTohono O'OdhamTonganTrinidadian and TobagonianTsimshianTurkishU.S. Virgin IslanderUgandanUkrainianUruguayanUteVenezuelanVietnameseWelshWest IndianYakamaYaquiYugoslavianYumanYup'ikZimbabwean
Immigration
NonimmigrantsImmigrantsAfghanistanAfricaAlbaniaArgentinaArmeniaAsiaAustraliaAustriaBahamasBangladeshBarbadosBelarusBelgiumBelizeBoliviaBosnia and HerzegovinaBrazilBulgariaBurma/MyanmarCabo VerdeCambodiaCameroonCanadaCaribbeanCentral AmericaChileChinaColombiaCongoCosta RicaCroatiaCubaCzechoslovakiaDenmarkDominicaDominican RepublicEastern AfricaEastern AsiaEastern EuropeEcuadorEgyptEl SalvadorEnglandEritreaEthiopiaEuropeFijiFranceGermanyGhanaGreeceGrenadaGuatemalaGuyanaHaitiHondurasHong KongHungaryIndiaIndonesiaIranIraqIrelandIsraelItalyJamaicaJapanJordanKazakhstanKenyaKoreaKuwaitLaosLatin AmericaLatviaLebanonLiberiaLithuaniaMalaysiaMexicoMicronesiaMiddle AfricaMoldovaMoroccoNepalNetherlandsNicaraguaNigeriaNorth AmericaNorth MacedoniaNorthern AfricaNorthern EuropeNorwayOceaniaPakistanPanamaPeruPhilippinesPolandPortugalRomaniaRussiaSaudi ArabiaScotlandSenegalSerbiaSierra LeoneSingaporeSomaliaSouth AfricaSouth AmericaSouth Central AsiaSouth Eastern AsiaSouthern EuropeSpainSri LankaSt. Vincent and the GrenadinesSudanSwedenSwitzerlandSyriaTaiwanThailandTrinidad and TobagoTurkeyUgandaUkraineUruguayUzbekistanVenezuelaVietnamWest IndiesWestern AfricaWestern AsiaWestern EuropeZaireZimbabweAzores
Unemployment Among Ages 20 to 24 years
Income
Poverty
Unemployment
Labor Participation
Family Structure
Vehicle Availability
Education Level
Disability

Unemployment Among Ages 20 to 24 years Comparison

Immigrants from Yemen

Scotch-Irish

Tragic
Exceptional
14.9%
UNEMPLOYMENT AMONG AGES 20 TO 24 YEARS
0.0/ 100
METRIC RATING
339th/ 347
METRIC RANK
10.0%
UNEMPLOYMENT AMONG AGES 20 TO 24 YEARS
96.2/ 100
METRIC RATING
95th/ 347
METRIC RANK

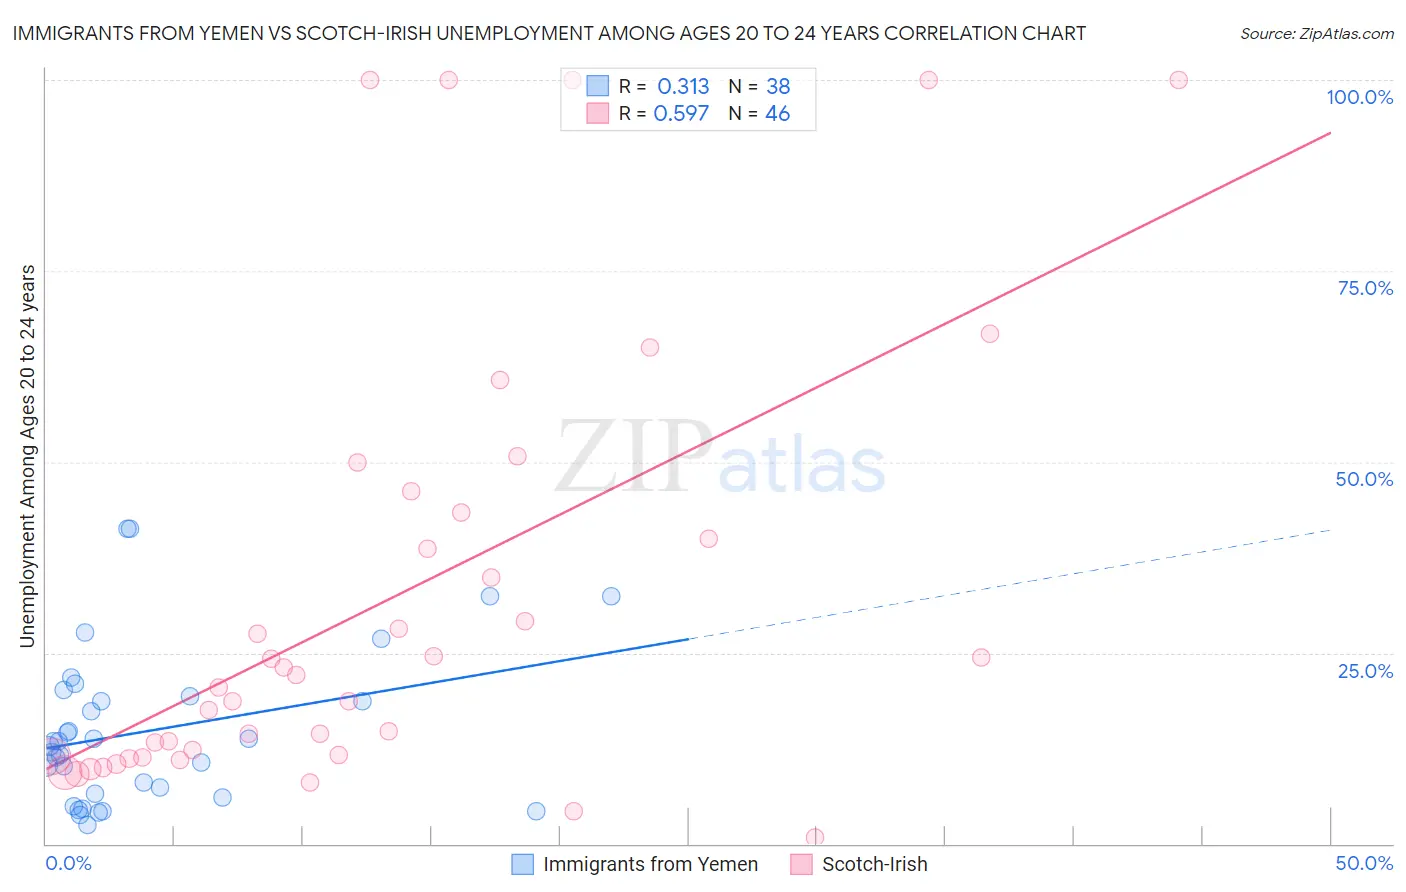
Immigrants from Yemen vs Scotch-Irish Unemployment Among Ages 20 to 24 years Correlation Chart

The statistical analysis conducted on geographies consisting of 82,154,441 people shows a mild positive correlation between the proportion of Immigrants from Yemen and unemployment rate among population between the ages 20 and 24 in the United States with a correlation coefficient (R) of 0.313 and weighted average of 14.9%. Similarly, the statistical analysis conducted on geographies consisting of 505,476,412 people shows a substantial positive correlation between the proportion of Scotch-Irish and unemployment rate among population between the ages 20 and 24 in the United States with a correlation coefficient (R) of 0.597 and weighted average of 10.0%, a difference of 48.9%.
Immigrants from Yemen vs Scotch-Irish Unemployment Among Ages 20 to 24 years

Unemployment Among Ages 20 to 24 years Correlation Summary

MeasurementImmigrants from YemenScotch-Irish
Minimum2.5%0.90%
Maximum41.3%100.0%
Range38.8%99.1%
Mean14.8%32.1%
Median13.1%21.2%
Interquartile 25% (IQ1)6.5%11.5%
Interquartile 75% (IQ3)19.3%43.4%
Interquartile Range (IQR)12.8%31.9%
Standard Deviation (Sample)10.1%28.8%
Standard Deviation (Population)10.0%28.5%

Similar Demographics by Unemployment Among Ages 20 to 24 years

Demographics Similar to Immigrants from Yemen by Unemployment Among Ages 20 to 24 years

In terms of unemployment among ages 20 to 24 years, the demographic groups most similar to Immigrants from Yemen are Immigrants from St. Vincent and the Grenadines (14.3%, a difference of 3.8%), Paiute (14.3%, a difference of 3.8%), Pima (14.2%, a difference of 4.9%), Sioux (14.2%, a difference of 5.1%), and Yuman (15.8%, a difference of 6.4%).
DemographicsRating | RankUnemployment Among Ages 20 to 24 years
Immigrants | Grenada
0.0
/100
|
#332
Tragic
13.8%
Immigrants | Guyana
0.0
/100
|
#333
Tragic
13.9%
Guyanese
0.0
/100
|
#334
Tragic
14.0%
Sioux
0.0
/100
|
#335
Tragic
14.2%
Pima
0.0
/100
|
#336
Tragic
14.2%
Paiute
0.0
/100
|
#337
Tragic
14.3%
Immigrants | St. Vincent and the Grenadines
0.0
/100
|
#338
Tragic
14.3%
Immigrants | Yemen
0.0
/100
|
#339
Tragic
14.9%
Yuman
0.0
/100
|
#340
Tragic
15.8%
Navajo
0.0
/100
|
#341
Tragic
16.1%
Puerto Ricans
0.0
/100
|
#342
Tragic
16.7%
Tsimshian
0.0
/100
|
#343
Tragic
18.0%
Crow
0.0
/100
|
#344
Tragic
18.7%
Hopi
0.0
/100
|
#345
Tragic
19.9%
Yup'ik
0.0
/100
|
#346
Tragic
20.9%

Demographics Similar to Scotch-Irish by Unemployment Among Ages 20 to 24 years

In terms of unemployment among ages 20 to 24 years, the demographic groups most similar to Scotch-Irish are Thai (10.0%, a difference of 0.0%), Slavic (10.0%, a difference of 0.040%), Immigrants from Micronesia (10.0%, a difference of 0.10%), Immigrants from Malaysia (10.0%, a difference of 0.19%), and Bangladeshi (10.0%, a difference of 0.20%).
DemographicsRating | RankUnemployment Among Ages 20 to 24 years
Poles
97.1
/100
|
#88
Exceptional
10.0%
Macedonians
97.0
/100
|
#89
Exceptional
10.0%
Chileans
97.0
/100
|
#90
Exceptional
10.0%
Bhutanese
96.9
/100
|
#91
Exceptional
10.0%
Bangladeshis
96.9
/100
|
#92
Exceptional
10.0%
Immigrants | Malaysia
96.9
/100
|
#93
Exceptional
10.0%
Immigrants | Micronesia
96.6
/100
|
#94
Exceptional
10.0%
Scotch-Irish
96.2
/100
|
#95
Exceptional
10.0%
Thais
96.2
/100
|
#96
Exceptional
10.0%
Slavs
96.1
/100
|
#97
Exceptional
10.0%
Japanese
95.4
/100
|
#98
Exceptional
10.0%
Fijians
95.3
/100
|
#99
Exceptional
10.0%
Immigrants | France
95.2
/100
|
#100
Exceptional
10.0%
Laotians
95.1
/100
|
#101
Exceptional
10.0%
Immigrants | Argentina
94.9
/100
|
#102
Exceptional
10.0%