Immigrants from Western Europe vs Belizean Unemployment Among Women with Children Under 18 years

COMPARE

Immigrants from Western Europe
Race
Ancestry
AfghanAfricanAlaska NativeAlaskan AthabascanAlbanianAleutAlsatianAmericanApacheArabArapahoArgentineanArmenianAssyrian/Chaldean/SyriacAustralianAustrianBahamianBangladeshiBarbadianBasqueBelgianBermudanBhutaneseBlackfeetBolivianBrazilianBritishBritish West IndianBulgarianBurmeseCajunCambodianCanadianCape VerdeanCarpatho RusynCelticCentral AmericanCentral American IndianCherokeeCheyenneChickasawChileanChineseChippewaChoctawColombianColvilleComancheCosta RicanCreeCreekCroatianCrowCubanCypriotCzechCzechoslovakianDanishDelawareDominicanDutchDutch West IndianEastern EuropeanEcuadorianEgyptianEnglishEstonianEthiopianEuropeanFijianFilipinoFinnishFrenchFrench American IndianFrench CanadianGermanGerman RussianGhanaianGreekGuamanian/ChamorroGuatemalanGuyaneseHaitianHmongHonduranHopiHoumaHungarianIcelanderIndian (Asian)IndonesianInupiatIranianIraqiIrishIroquoisIsraeliItalianJamaicanJapaneseJordanianKenyanKiowaKoreanLaotianLatvianLebaneseLiberianLithuanianLumbeeLuxembourgerMacedonianMalaysianMalteseMarshalleseMenomineeMexicanMexican American IndianMongolianMoroccanNative HawaiianNavajoNepaleseNew ZealanderNicaraguanNigerianNorthern EuropeanNorwegianOkinawanOsageOttawaPaiutePakistaniPalestinianPanamanianParaguayanPennsylvania GermanPeruvianPimaPolishPortuguesePotawatomiPuebloPuerto RicanPuget Sound SalishRomanianRussianSalvadoranSamoanScandinavianScotch-IrishScottishSeminoleSenegaleseSerbianShoshoneSierra LeoneanSiouxSlavicSlovakSloveneSomaliSouth AfricanSouth AmericanSouth American IndianSoviet UnionSpaniardSpanishSpanish AmericanSpanish American IndianSri LankanSubsaharan AfricanSudaneseSwedishSwissSyrianTaiwaneseThaiTlingit-HaidaTohono O'OdhamTonganTrinidadian and TobagonianTsimshianTurkishU.S. Virgin IslanderUgandanUkrainianUruguayanUteVenezuelanVietnameseWelshWest IndianYakamaYaquiYugoslavianYumanYup'ikZimbabwean
Immigration
NonimmigrantsImmigrantsAfghanistanAfricaAlbaniaArgentinaArmeniaAsiaAustraliaAustriaBahamasBangladeshBarbadosBelarusBelgiumBelizeBoliviaBosnia and HerzegovinaBrazilBulgariaBurma/MyanmarCabo VerdeCambodiaCameroonCanadaCaribbeanCentral AmericaChileChinaColombiaCongoCosta RicaCroatiaCubaCzechoslovakiaDenmarkDominicaDominican RepublicEastern AfricaEastern AsiaEastern EuropeEcuadorEgyptEl SalvadorEnglandEritreaEthiopiaEuropeFijiFranceGermanyGhanaGreeceGrenadaGuatemalaGuyanaHaitiHondurasHong KongHungaryIndiaIndonesiaIranIraqIrelandIsraelItalyJamaicaJapanJordanKazakhstanKenyaKoreaKuwaitLaosLatin AmericaLatviaLebanonLiberiaLithuaniaMalaysiaMexicoMicronesiaMiddle AfricaMoldovaMoroccoNepalNetherlandsNicaraguaNigeriaNorth AmericaNorth MacedoniaNorthern AfricaNorthern EuropeNorwayOceaniaPakistanPanamaPeruPhilippinesPolandPortugalRomaniaRussiaSaudi ArabiaScotlandSenegalSerbiaSierra LeoneSingaporeSomaliaSouth AfricaSouth AmericaSouth Central AsiaSouth Eastern AsiaSouthern EuropeSpainSri LankaSt. Vincent and the GrenadinesSudanSwedenSwitzerlandSyriaTaiwanThailandTrinidad and TobagoTurkeyUgandaUkraineUruguayUzbekistanVenezuelaVietnamWest IndiesWestern AfricaWestern AsiaWestern EuropeYemenZaireZimbabweAzores
Belizean
Race
Ancestry
AfghanAfricanAlaska NativeAlaskan AthabascanAlbanianAleutAlsatianAmericanApacheArabArapahoArgentineanArmenianAssyrian/Chaldean/SyriacAustralianAustrianBahamianBangladeshiBarbadianBasqueBelgianBelizeanBermudanBhutaneseBlackfeetBolivianBrazilianBritishBritish West IndianBulgarianBurmeseCajunCambodianCanadianCape VerdeanCarpatho RusynCelticCentral AmericanCentral American IndianCherokeeCheyenneChickasawChileanChineseChippewaChoctawColombianColvilleComancheCosta RicanCreeCreekCroatianCrowCubanCypriotCzechCzechoslovakianDanishDelawareDominicanDutchDutch West IndianEastern EuropeanEcuadorianEgyptianEnglishEstonianEthiopianEuropeanFijianFilipinoFinnishFrenchFrench American IndianFrench CanadianGermanGerman RussianGhanaianGreekGuamanian/ChamorroGuatemalanGuyaneseHaitianHmongHonduranHopiHoumaHungarianIcelanderIndian (Asian)IndonesianInupiatIranianIraqiIrishIroquoisIsraeliItalianJamaicanJapaneseJordanianKenyanKiowaKoreanLaotianLatvianLebaneseLiberianLithuanianLumbeeLuxembourgerMacedonianMalaysianMalteseMarshalleseMenomineeMexicanMexican American IndianMongolianMoroccanNative HawaiianNavajoNepaleseNew ZealanderNicaraguanNigerianNorthern EuropeanNorwegianOkinawanOsageOttawaPaiutePakistaniPalestinianPanamanianParaguayanPennsylvania GermanPeruvianPimaPolishPortuguesePotawatomiPuebloPuerto RicanPuget Sound SalishRomanianRussianSalvadoranSamoanScandinavianScotch-IrishScottishSeminoleSenegaleseSerbianShoshoneSierra LeoneanSiouxSlavicSlovakSloveneSomaliSouth AfricanSouth AmericanSouth American IndianSoviet UnionSpaniardSpanishSpanish AmericanSpanish American IndianSri LankanSubsaharan AfricanSudaneseSwedishSwissSyrianTaiwaneseThaiTlingit-HaidaTohono O'OdhamTonganTrinidadian and TobagonianTsimshianTurkishU.S. Virgin IslanderUgandanUkrainianUruguayanUteVenezuelanVietnameseWelshWest IndianYakamaYaquiYugoslavianYumanYup'ikZimbabwean
Immigration
NonimmigrantsImmigrantsAfghanistanAfricaAlbaniaArgentinaArmeniaAsiaAustraliaAustriaBahamasBangladeshBarbadosBelarusBelgiumBelizeBoliviaBosnia and HerzegovinaBrazilBulgariaBurma/MyanmarCabo VerdeCambodiaCameroonCanadaCaribbeanCentral AmericaChileChinaColombiaCongoCosta RicaCroatiaCubaCzechoslovakiaDenmarkDominicaDominican RepublicEastern AfricaEastern AsiaEastern EuropeEcuadorEgyptEl SalvadorEnglandEritreaEthiopiaEuropeFijiFranceGermanyGhanaGreeceGrenadaGuatemalaGuyanaHaitiHondurasHong KongHungaryIndiaIndonesiaIranIraqIrelandIsraelItalyJamaicaJapanJordanKazakhstanKenyaKoreaKuwaitLaosLatin AmericaLatviaLebanonLiberiaLithuaniaMalaysiaMexicoMicronesiaMiddle AfricaMoldovaMoroccoNepalNetherlandsNicaraguaNigeriaNorth AmericaNorth MacedoniaNorthern AfricaNorthern EuropeNorwayOceaniaPakistanPanamaPeruPhilippinesPolandPortugalRomaniaRussiaSaudi ArabiaScotlandSenegalSerbiaSierra LeoneSingaporeSomaliaSouth AfricaSouth AmericaSouth Central AsiaSouth Eastern AsiaSouthern EuropeSpainSri LankaSt. Vincent and the GrenadinesSudanSwedenSwitzerlandSyriaTaiwanThailandTrinidad and TobagoTurkeyUgandaUkraineUruguayUzbekistanVenezuelaVietnamWest IndiesWestern AfricaWestern AsiaYemenZaireZimbabweAzores
Unemployment Among Women with Children Under 18 years
Income
Poverty
Unemployment
Labor Participation
Family Structure
Vehicle Availability
Education Level
Disability

Unemployment Among Women with Children Under 18 years Comparison

Immigrants from Western Europe

Belizeans

Good
Tragic
5.4%
UNEMPLOYMENT AMONG WOMEN WITH CHILDREN UNDER 18 YEARS
72.8/ 100
METRIC RATING
148th/ 347
METRIC RANK
6.5%
UNEMPLOYMENT AMONG WOMEN WITH CHILDREN UNDER 18 YEARS
0.0/ 100
METRIC RATING
307th/ 347
METRIC RANK

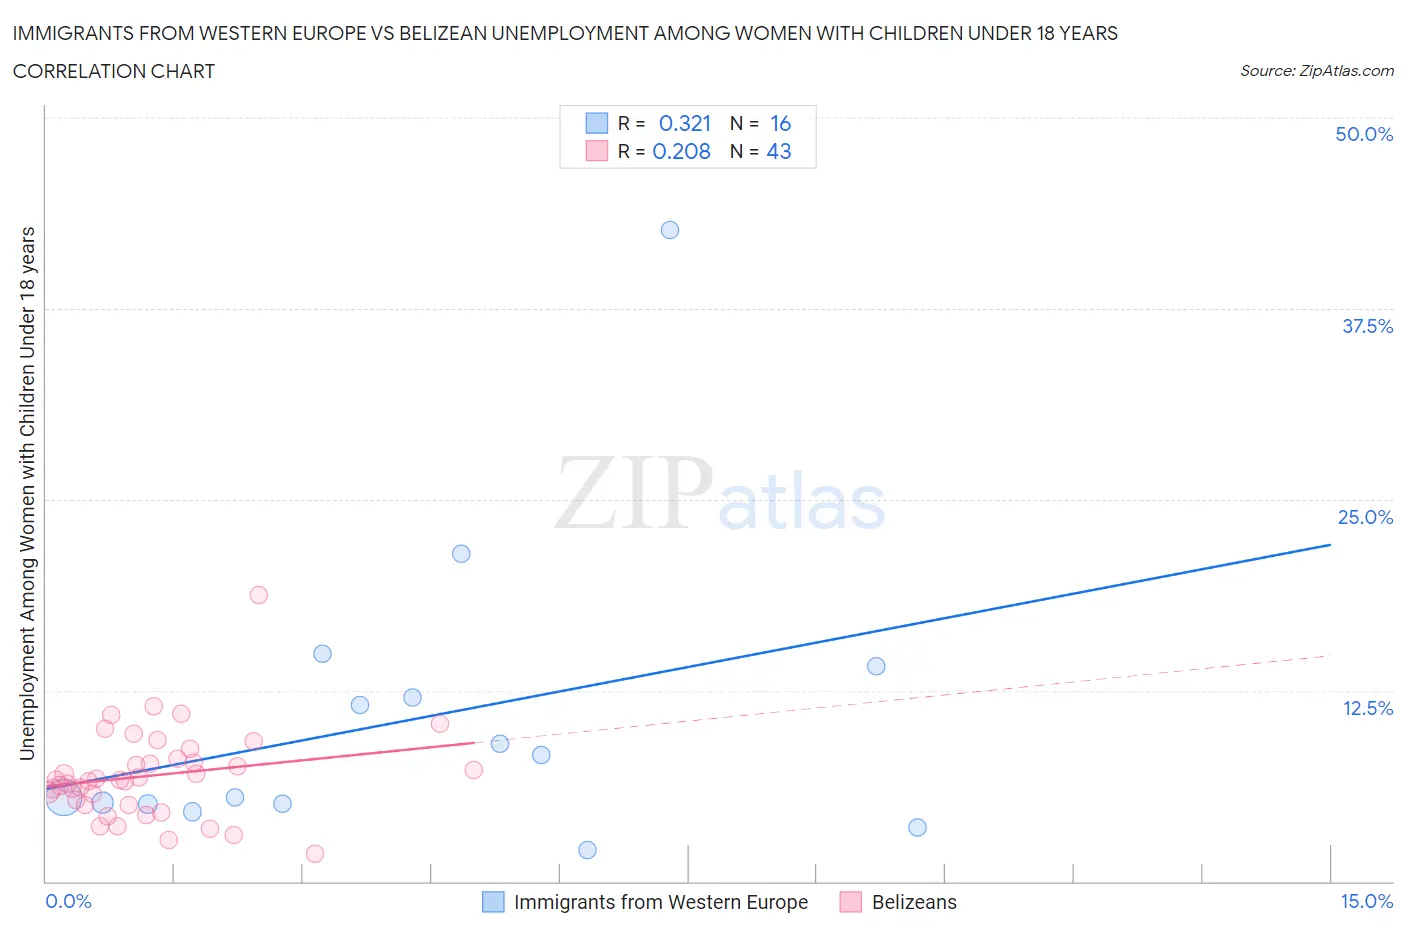
Immigrants from Western Europe vs Belizean Unemployment Among Women with Children Under 18 years Correlation Chart

The statistical analysis conducted on geographies consisting of 463,425,989 people shows a mild positive correlation between the proportion of Immigrants from Western Europe and unemployment rate among women with children under the age of 18 in the United States with a correlation coefficient (R) of 0.321 and weighted average of 5.4%. Similarly, the statistical analysis conducted on geographies consisting of 142,666,018 people shows a weak positive correlation between the proportion of Belizeans and unemployment rate among women with children under the age of 18 in the United States with a correlation coefficient (R) of 0.208 and weighted average of 6.5%, a difference of 21.9%.
Immigrants from Western Europe vs Belizean Unemployment Among Women with Children Under 18 years

Unemployment Among Women with Children Under 18 years Correlation Summary

MeasurementImmigrants from Western EuropeBelizean
Minimum2.1%1.8%
Maximum42.7%18.8%
Range40.6%17.0%
Mean10.6%6.9%
Median6.9%6.6%
Interquartile 25% (IQ1)5.1%5.0%
Interquartile 75% (IQ3)13.0%8.0%
Interquartile Range (IQR)8.0%3.0%
Standard Deviation (Sample)10.0%3.0%
Standard Deviation (Population)9.6%2.9%

Similar Demographics by Unemployment Among Women with Children Under 18 years

Demographics Similar to Immigrants from Western Europe by Unemployment Among Women with Children Under 18 years

In terms of unemployment among women with children under 18 years, the demographic groups most similar to Immigrants from Western Europe are Bangladeshi (5.3%, a difference of 0.030%), Immigrants from Belarus (5.3%, a difference of 0.050%), Immigrants from Kenya (5.4%, a difference of 0.060%), Immigrants from Argentina (5.4%, a difference of 0.10%), and Immigrants from Egypt (5.3%, a difference of 0.11%).
DemographicsRating | RankUnemployment Among Women with Children Under 18 years
Venezuelans
76.0
/100
|
#141
Good
5.3%
Immigrants | Venezuela
75.4
/100
|
#142
Good
5.3%
Chileans
75.0
/100
|
#143
Good
5.3%
Immigrants | England
74.9
/100
|
#144
Good
5.3%
Immigrants | Egypt
74.0
/100
|
#145
Good
5.3%
Immigrants | Belarus
73.4
/100
|
#146
Good
5.3%
Bangladeshis
73.2
/100
|
#147
Good
5.3%
Immigrants | Western Europe
72.8
/100
|
#148
Good
5.4%
Immigrants | Kenya
72.2
/100
|
#149
Good
5.4%
Immigrants | Argentina
71.7
/100
|
#150
Good
5.4%
Immigrants | Iran
71.1
/100
|
#151
Good
5.4%
Immigrants | South Eastern Asia
71.1
/100
|
#152
Good
5.4%
Carpatho Rusyns
70.8
/100
|
#153
Good
5.4%
Immigrants | Latvia
70.8
/100
|
#154
Good
5.4%
Koreans
70.5
/100
|
#155
Good
5.4%

Demographics Similar to Belizeans by Unemployment Among Women with Children Under 18 years

In terms of unemployment among women with children under 18 years, the demographic groups most similar to Belizeans are Immigrants from Guyana (6.5%, a difference of 0.070%), Immigrants from Central America (6.5%, a difference of 0.12%), African (6.5%, a difference of 0.22%), Ecuadorian (6.5%, a difference of 0.31%), and Guyanese (6.6%, a difference of 0.55%).
DemographicsRating | RankUnemployment Among Women with Children Under 18 years
Immigrants | Jamaica
0.0
/100
|
#300
Tragic
6.4%
Immigrants | Haiti
0.0
/100
|
#301
Tragic
6.4%
Immigrants | Armenia
0.0
/100
|
#302
Tragic
6.5%
Immigrants | Honduras
0.0
/100
|
#303
Tragic
6.5%
Vietnamese
0.0
/100
|
#304
Tragic
6.5%
Immigrants | Central America
0.0
/100
|
#305
Tragic
6.5%
Immigrants | Guyana
0.0
/100
|
#306
Tragic
6.5%
Belizeans
0.0
/100
|
#307
Tragic
6.5%
Africans
0.0
/100
|
#308
Tragic
6.5%
Ecuadorians
0.0
/100
|
#309
Tragic
6.5%
Guyanese
0.0
/100
|
#310
Tragic
6.6%
Yaqui
0.0
/100
|
#311
Tragic
6.6%
Immigrants | Mexico
0.0
/100
|
#312
Tragic
6.6%
Hispanics or Latinos
0.0
/100
|
#313
Tragic
6.6%
British West Indians
0.0
/100
|
#314
Tragic
6.6%