Immigrants from Western Asia vs Immigrants from Senegal Unemployment Among Youth under 25 years

COMPARE

Immigrants from Western Asia
Race
Ancestry
AfghanAfricanAlaska NativeAlaskan AthabascanAlbanianAleutAlsatianAmericanApacheArabArapahoArgentineanArmenianAssyrian/Chaldean/SyriacAustralianAustrianBahamianBangladeshiBarbadianBasqueBelgianBelizeanBermudanBhutaneseBlackfeetBolivianBrazilianBritishBritish West IndianBulgarianBurmeseCajunCambodianCanadianCape VerdeanCarpatho RusynCelticCentral AmericanCentral American IndianCherokeeCheyenneChickasawChileanChineseChippewaChoctawColombianColvilleComancheCosta RicanCreeCreekCroatianCrowCubanCypriotCzechCzechoslovakianDanishDelawareDominicanDutchDutch West IndianEastern EuropeanEcuadorianEgyptianEnglishEstonianEthiopianEuropeanFijianFilipinoFinnishFrenchFrench American IndianFrench CanadianGermanGerman RussianGhanaianGreekGuamanian/ChamorroGuatemalanGuyaneseHaitianHmongHonduranHopiHoumaHungarianIcelanderIndian (Asian)IndonesianInupiatIranianIraqiIrishIroquoisIsraeliItalianJamaicanJapaneseJordanianKenyanKiowaKoreanLaotianLatvianLebaneseLiberianLithuanianLumbeeLuxembourgerMacedonianMalaysianMalteseMarshalleseMenomineeMexicanMexican American IndianMongolianMoroccanNative HawaiianNavajoNepaleseNew ZealanderNicaraguanNigerianNorthern EuropeanNorwegianOkinawanOsageOttawaPaiutePakistaniPalestinianPanamanianParaguayanPennsylvania GermanPeruvianPimaPolishPortuguesePotawatomiPuebloPuerto RicanPuget Sound SalishRomanianRussianSalvadoranSamoanScandinavianScotch-IrishScottishSeminoleSenegaleseSerbianShoshoneSierra LeoneanSiouxSlavicSlovakSloveneSomaliSouth AfricanSouth AmericanSouth American IndianSoviet UnionSpaniardSpanishSpanish AmericanSpanish American IndianSri LankanSubsaharan AfricanSudaneseSwedishSwissSyrianTaiwaneseThaiTlingit-HaidaTohono O'OdhamTonganTrinidadian and TobagonianTsimshianTurkishU.S. Virgin IslanderUgandanUkrainianUruguayanUteVenezuelanVietnameseWelshWest IndianYakamaYaquiYugoslavianYumanYup'ikZimbabwean
Immigration
NonimmigrantsImmigrantsAfghanistanAfricaAlbaniaArgentinaArmeniaAsiaAustraliaAustriaBahamasBangladeshBarbadosBelarusBelgiumBelizeBoliviaBosnia and HerzegovinaBrazilBulgariaBurma/MyanmarCabo VerdeCambodiaCameroonCanadaCaribbeanCentral AmericaChileChinaColombiaCongoCosta RicaCroatiaCubaCzechoslovakiaDenmarkDominicaDominican RepublicEastern AfricaEastern AsiaEastern EuropeEcuadorEgyptEl SalvadorEnglandEritreaEthiopiaEuropeFijiFranceGermanyGhanaGreeceGrenadaGuatemalaGuyanaHaitiHondurasHong KongHungaryIndiaIndonesiaIranIraqIrelandIsraelItalyJamaicaJapanJordanKazakhstanKenyaKoreaKuwaitLaosLatin AmericaLatviaLebanonLiberiaLithuaniaMalaysiaMexicoMicronesiaMiddle AfricaMoldovaMoroccoNepalNetherlandsNicaraguaNigeriaNorth AmericaNorth MacedoniaNorthern AfricaNorthern EuropeNorwayOceaniaPakistanPanamaPeruPhilippinesPolandPortugalRomaniaRussiaSaudi ArabiaScotlandSerbiaSierra LeoneSingaporeSomaliaSouth AfricaSouth AmericaSouth Central AsiaSouth Eastern AsiaSouthern EuropeSpainSri LankaSt. Vincent and the GrenadinesSudanSwedenSwitzerlandSyriaTaiwanThailandTrinidad and TobagoTurkeyUgandaUkraineUruguayUzbekistanVenezuelaVietnamWest IndiesWestern AfricaWestern AsiaWestern EuropeYemenZaireZimbabweAzores
Immigrants from Senegal
Race
Ancestry
AfghanAfricanAlaska NativeAlaskan AthabascanAlbanianAleutAlsatianAmericanApacheArabArapahoArgentineanArmenianAssyrian/Chaldean/SyriacAustralianAustrianBahamianBangladeshiBarbadianBasqueBelgianBelizeanBermudanBhutaneseBlackfeetBolivianBrazilianBritishBritish West IndianBulgarianBurmeseCajunCambodianCanadianCape VerdeanCarpatho RusynCelticCentral AmericanCentral American IndianCherokeeCheyenneChickasawChileanChineseChippewaChoctawColombianColvilleComancheCosta RicanCreeCreekCroatianCrowCubanCypriotCzechCzechoslovakianDanishDelawareDominicanDutchDutch West IndianEastern EuropeanEcuadorianEgyptianEnglishEstonianEthiopianEuropeanFijianFilipinoFinnishFrenchFrench American IndianFrench CanadianGermanGerman RussianGhanaianGreekGuamanian/ChamorroGuatemalanGuyaneseHaitianHmongHonduranHopiHoumaHungarianIcelanderIndian (Asian)IndonesianInupiatIranianIraqiIrishIroquoisIsraeliItalianJamaicanJapaneseJordanianKenyanKiowaKoreanLaotianLatvianLebaneseLiberianLithuanianLumbeeLuxembourgerMacedonianMalaysianMalteseMarshalleseMenomineeMexicanMexican American IndianMongolianMoroccanNative HawaiianNavajoNepaleseNew ZealanderNicaraguanNigerianNorthern EuropeanNorwegianOkinawanOsageOttawaPaiutePakistaniPalestinianPanamanianParaguayanPennsylvania GermanPeruvianPimaPolishPortuguesePotawatomiPuebloPuerto RicanPuget Sound SalishRomanianRussianSalvadoranSamoanScandinavianScotch-IrishScottishSeminoleSenegaleseSerbianShoshoneSierra LeoneanSiouxSlavicSlovakSloveneSomaliSouth AfricanSouth AmericanSouth American IndianSoviet UnionSpaniardSpanishSpanish AmericanSpanish American IndianSri LankanSubsaharan AfricanSudaneseSwedishSwissSyrianTaiwaneseThaiTlingit-HaidaTohono O'OdhamTonganTrinidadian and TobagonianTsimshianTurkishU.S. Virgin IslanderUgandanUkrainianUruguayanUteVenezuelanVietnameseWelshWest IndianYakamaYaquiYugoslavianYumanYup'ikZimbabwean
Immigration
NonimmigrantsImmigrantsAfghanistanAfricaAlbaniaArgentinaArmeniaAsiaAustraliaAustriaBahamasBangladeshBarbadosBelarusBelgiumBelizeBoliviaBosnia and HerzegovinaBrazilBulgariaBurma/MyanmarCabo VerdeCambodiaCameroonCanadaCaribbeanCentral AmericaChileChinaColombiaCongoCosta RicaCroatiaCubaCzechoslovakiaDenmarkDominicaDominican RepublicEastern AfricaEastern AsiaEastern EuropeEcuadorEgyptEl SalvadorEnglandEritreaEthiopiaEuropeFijiFranceGermanyGhanaGreeceGrenadaGuatemalaGuyanaHaitiHondurasHong KongHungaryIndiaIndonesiaIranIraqIrelandIsraelItalyJamaicaJapanJordanKazakhstanKenyaKoreaKuwaitLaosLatin AmericaLatviaLebanonLiberiaLithuaniaMalaysiaMexicoMicronesiaMiddle AfricaMoldovaMoroccoNepalNetherlandsNicaraguaNigeriaNorth AmericaNorth MacedoniaNorthern AfricaNorthern EuropeNorwayOceaniaPakistanPanamaPeruPhilippinesPolandPortugalRomaniaRussiaSaudi ArabiaScotlandSenegalSerbiaSierra LeoneSingaporeSomaliaSouth AfricaSouth AmericaSouth Central AsiaSouth Eastern AsiaSouthern EuropeSpainSri LankaSt. Vincent and the GrenadinesSudanSwedenSwitzerlandSyriaTaiwanThailandTrinidad and TobagoTurkeyUgandaUkraineUruguayUzbekistanVenezuelaVietnamWest IndiesWestern AfricaWestern EuropeYemenZaireZimbabweAzores
Unemployment Among Youth under 25 years
Income
Poverty
Unemployment
Labor Participation
Family Structure
Vehicle Availability
Education Level
Disability

Unemployment Among Youth under 25 years Comparison

Immigrants from Western Asia

Immigrants from Senegal

Tragic
Tragic
12.2%
UNEMPLOYMENT AMONG YOUTH UNDER 25 YEARS
0.8/ 100
METRIC RATING
242nd/ 347
METRIC RANK
13.8%
UNEMPLOYMENT AMONG YOUTH UNDER 25 YEARS
0.0/ 100
METRIC RATING
301st/ 347
METRIC RANK

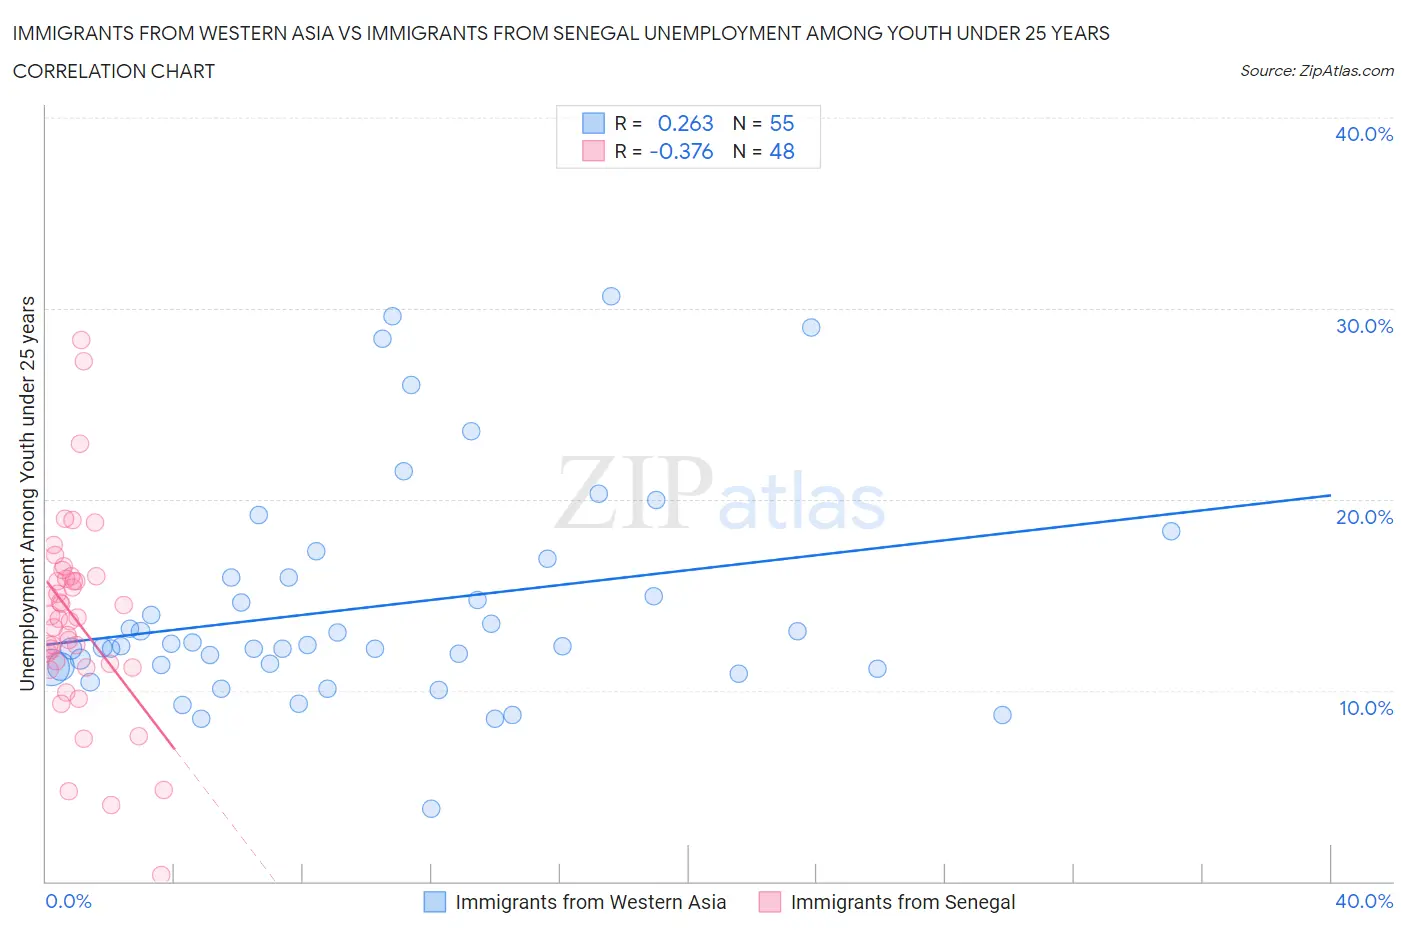
Immigrants from Western Asia vs Immigrants from Senegal Unemployment Among Youth under 25 years Correlation Chart

The statistical analysis conducted on geographies consisting of 399,982,052 people shows a weak positive correlation between the proportion of Immigrants from Western Asia and unemployment rate among youth under the age of 25 in the United States with a correlation coefficient (R) of 0.263 and weighted average of 12.2%. Similarly, the statistical analysis conducted on geographies consisting of 90,014,443 people shows a mild negative correlation between the proportion of Immigrants from Senegal and unemployment rate among youth under the age of 25 in the United States with a correlation coefficient (R) of -0.376 and weighted average of 13.8%, a difference of 13.5%.
Immigrants from Western Asia vs Immigrants from Senegal Unemployment Among Youth under 25 years

Unemployment Among Youth under 25 years Correlation Summary

MeasurementImmigrants from Western AsiaImmigrants from Senegal
Minimum3.8%0.30%
Maximum30.7%28.3%
Range26.9%28.0%
Mean14.4%13.7%
Median12.3%13.8%
Interquartile 25% (IQ1)11.2%11.3%
Interquartile 75% (IQ3)15.9%15.9%
Interquartile Range (IQR)4.7%4.6%
Standard Deviation (Sample)5.8%5.1%
Standard Deviation (Population)5.7%5.1%

Similar Demographics by Unemployment Among Youth under 25 years

Demographics Similar to Immigrants from Western Asia by Unemployment Among Youth under 25 years

In terms of unemployment among youth under 25 years, the demographic groups most similar to Immigrants from Western Asia are Immigrants from the Azores (12.2%, a difference of 0.20%), Alaskan Athabascan (12.2%, a difference of 0.21%), Spanish American (12.2%, a difference of 0.22%), Immigrants from Honduras (12.2%, a difference of 0.22%), and Immigrants from Albania (12.1%, a difference of 0.32%).
DemographicsRating | RankUnemployment Among Youth under 25 years
Immigrants | Guatemala
1.4
/100
|
#235
Tragic
12.1%
Immigrants | Immigrants
1.3
/100
|
#236
Tragic
12.1%
Native Hawaiians
1.3
/100
|
#237
Tragic
12.1%
Albanians
1.2
/100
|
#238
Tragic
12.1%
Immigrants | Africa
1.1
/100
|
#239
Tragic
12.1%
Dutch West Indians
1.1
/100
|
#240
Tragic
12.1%
Immigrants | Albania
1.1
/100
|
#241
Tragic
12.1%
Immigrants | Western Asia
0.8
/100
|
#242
Tragic
12.2%
Immigrants | Azores
0.6
/100
|
#243
Tragic
12.2%
Alaskan Athabascans
0.6
/100
|
#244
Tragic
12.2%
Spanish Americans
0.6
/100
|
#245
Tragic
12.2%
Immigrants | Honduras
0.6
/100
|
#246
Tragic
12.2%
Immigrants | Greece
0.6
/100
|
#247
Tragic
12.2%
Central Americans
0.6
/100
|
#248
Tragic
12.2%
Soviet Union
0.6
/100
|
#249
Tragic
12.2%

Demographics Similar to Immigrants from Senegal by Unemployment Among Youth under 25 years

In terms of unemployment among youth under 25 years, the demographic groups most similar to Immigrants from Senegal are Immigrants from Sierra Leone (13.8%, a difference of 0.050%), Belizean (13.8%, a difference of 0.080%), Houma (13.8%, a difference of 0.090%), Immigrants from Cabo Verde (13.8%, a difference of 0.17%), and Tohono O'odham (13.8%, a difference of 0.38%).
DemographicsRating | RankUnemployment Among Youth under 25 years
Immigrants | Caribbean
0.0
/100
|
#294
Tragic
13.5%
Chippewa
0.0
/100
|
#295
Tragic
13.5%
Senegalese
0.0
/100
|
#296
Tragic
13.5%
U.S. Virgin Islanders
0.0
/100
|
#297
Tragic
13.6%
Shoshone
0.0
/100
|
#298
Tragic
13.7%
Tohono O'odham
0.0
/100
|
#299
Tragic
13.8%
Immigrants | Cabo Verde
0.0
/100
|
#300
Tragic
13.8%
Immigrants | Senegal
0.0
/100
|
#301
Tragic
13.8%
Immigrants | Sierra Leone
0.0
/100
|
#302
Tragic
13.8%
Belizeans
0.0
/100
|
#303
Tragic
13.8%
Houma
0.0
/100
|
#304
Tragic
13.8%
Haitians
0.0
/100
|
#305
Tragic
13.9%
Pueblo
0.0
/100
|
#306
Tragic
13.9%
Immigrants | Haiti
0.0
/100
|
#307
Tragic
14.0%
Immigrants | Belize
0.0
/100
|
#308
Tragic
14.0%