Immigrants from Western Africa vs Spaniard Unemployment
COMPARE
Immigrants from Western Africa
Spaniard
Unemployment
Unemployment Comparison
Immigrants from Western Africa
Spaniards
6.0%
UNEMPLOYMENT
0.0/ 100
METRIC RATING
280th/ 347
METRIC RANK
5.3%
UNEMPLOYMENT
42.2/ 100
METRIC RATING
182nd/ 347
METRIC RANK
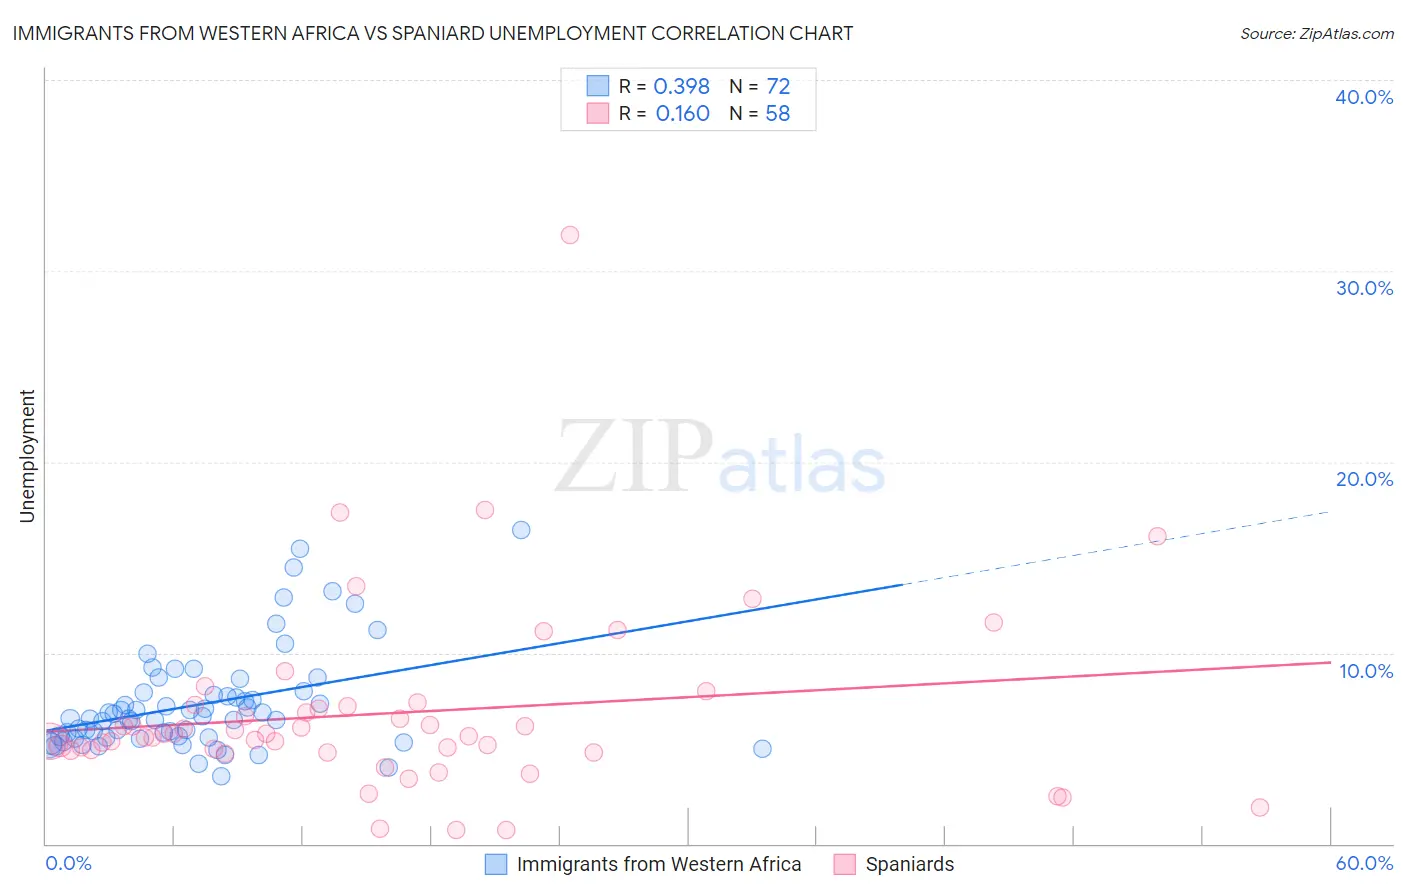
Immigrants from Western Africa vs Spaniard Unemployment Correlation Chart
The statistical analysis conducted on geographies consisting of 357,683,143 people shows a mild positive correlation between the proportion of Immigrants from Western Africa and unemployment in the United States with a correlation coefficient (R) of 0.398 and weighted average of 6.0%. Similarly, the statistical analysis conducted on geographies consisting of 442,859,385 people shows a poor positive correlation between the proportion of Spaniards and unemployment in the United States with a correlation coefficient (R) of 0.160 and weighted average of 5.3%, a difference of 13.9%.
Unemployment Correlation Summary
| Measurement | Immigrants from Western Africa | Spaniard |
| Minimum | 3.5% | 0.70% |
| Maximum | 16.4% | 31.9% |
| Range | 12.9% | 31.2% |
| Mean | 7.3% | 6.8% |
| Median | 6.5% | 5.7% |
| Interquartile 25% (IQ1) | 5.6% | 4.9% |
| Interquartile 75% (IQ3) | 7.9% | 7.2% |
| Interquartile Range (IQR) | 2.3% | 2.3% |
| Standard Deviation (Sample) | 2.7% | 4.9% |
| Standard Deviation (Population) | 2.6% | 4.9% |
Similar Demographics by Unemployment
Demographics Similar to Immigrants from Western Africa by Unemployment
In terms of unemployment, the demographic groups most similar to Immigrants from Western Africa are Immigrants from Mexico (6.0%, a difference of 0.0%), Ghanaian (6.0%, a difference of 0.43%), African (6.1%, a difference of 0.58%), Immigrants from the Azores (6.1%, a difference of 0.64%), and Armenian (6.0%, a difference of 0.73%).
| Demographics | Rating | Rank | Unemployment |
| Immigrants | Fiji | 0.0 /100 | #273 | Tragic 5.9% |
| Bahamians | 0.0 /100 | #274 | Tragic 5.9% |
| Immigrants | Latin America | 0.0 /100 | #275 | Tragic 5.9% |
| Immigrants | Central America | 0.0 /100 | #276 | Tragic 6.0% |
| Armenians | 0.0 /100 | #277 | Tragic 6.0% |
| Ghanaians | 0.0 /100 | #278 | Tragic 6.0% |
| Immigrants | Mexico | 0.0 /100 | #279 | Tragic 6.0% |
| Immigrants | Western Africa | 0.0 /100 | #280 | Tragic 6.0% |
| Africans | 0.0 /100 | #281 | Tragic 6.1% |
| Immigrants | Azores | 0.0 /100 | #282 | Tragic 6.1% |
| Immigrants | Ghana | 0.0 /100 | #283 | Tragic 6.1% |
| Aleuts | 0.0 /100 | #284 | Tragic 6.1% |
| Immigrants | Senegal | 0.0 /100 | #285 | Tragic 6.1% |
| Immigrants | Caribbean | 0.0 /100 | #286 | Tragic 6.2% |
| Nepalese | 0.0 /100 | #287 | Tragic 6.2% |
Demographics Similar to Spaniards by Unemployment
In terms of unemployment, the demographic groups most similar to Spaniards are Albanian (5.3%, a difference of 0.080%), Brazilian (5.3%, a difference of 0.13%), Immigrants from Greece (5.3%, a difference of 0.18%), Assyrian/Chaldean/Syriac (5.3%, a difference of 0.19%), and Immigrants from Thailand (5.3%, a difference of 0.21%).
| Demographics | Rating | Rank | Unemployment |
| Taiwanese | 49.6 /100 | #175 | Average 5.3% |
| Nicaraguans | 48.7 /100 | #176 | Average 5.3% |
| Immigrants | Nonimmigrants | 47.9 /100 | #177 | Average 5.3% |
| Afghans | 47.4 /100 | #178 | Average 5.3% |
| Malaysians | 46.8 /100 | #179 | Average 5.3% |
| Immigrants | Greece | 45.0 /100 | #180 | Average 5.3% |
| Albanians | 43.5 /100 | #181 | Average 5.3% |
| Spaniards | 42.2 /100 | #182 | Average 5.3% |
| Brazilians | 40.2 /100 | #183 | Average 5.3% |
| Assyrians/Chaldeans/Syriacs | 39.2 /100 | #184 | Fair 5.3% |
| Immigrants | Thailand | 38.9 /100 | #185 | Fair 5.3% |
| Immigrants | Uganda | 37.8 /100 | #186 | Fair 5.3% |
| Costa Ricans | 37.4 /100 | #187 | Fair 5.3% |
| Alsatians | 37.0 /100 | #188 | Fair 5.3% |
| Immigrants | Belarus | 35.6 /100 | #189 | Fair 5.3% |