Immigrants from West Indies vs Sri Lankan Unemployment
COMPARE
Immigrants from West Indies
Sri Lankan
Unemployment
Unemployment Comparison
Immigrants from West Indies
Sri Lankans
6.3%
UNEMPLOYMENT
0.0/ 100
METRIC RATING
299th/ 347
METRIC RANK
5.2%
UNEMPLOYMENT
69.5/ 100
METRIC RATING
157th/ 347
METRIC RANK
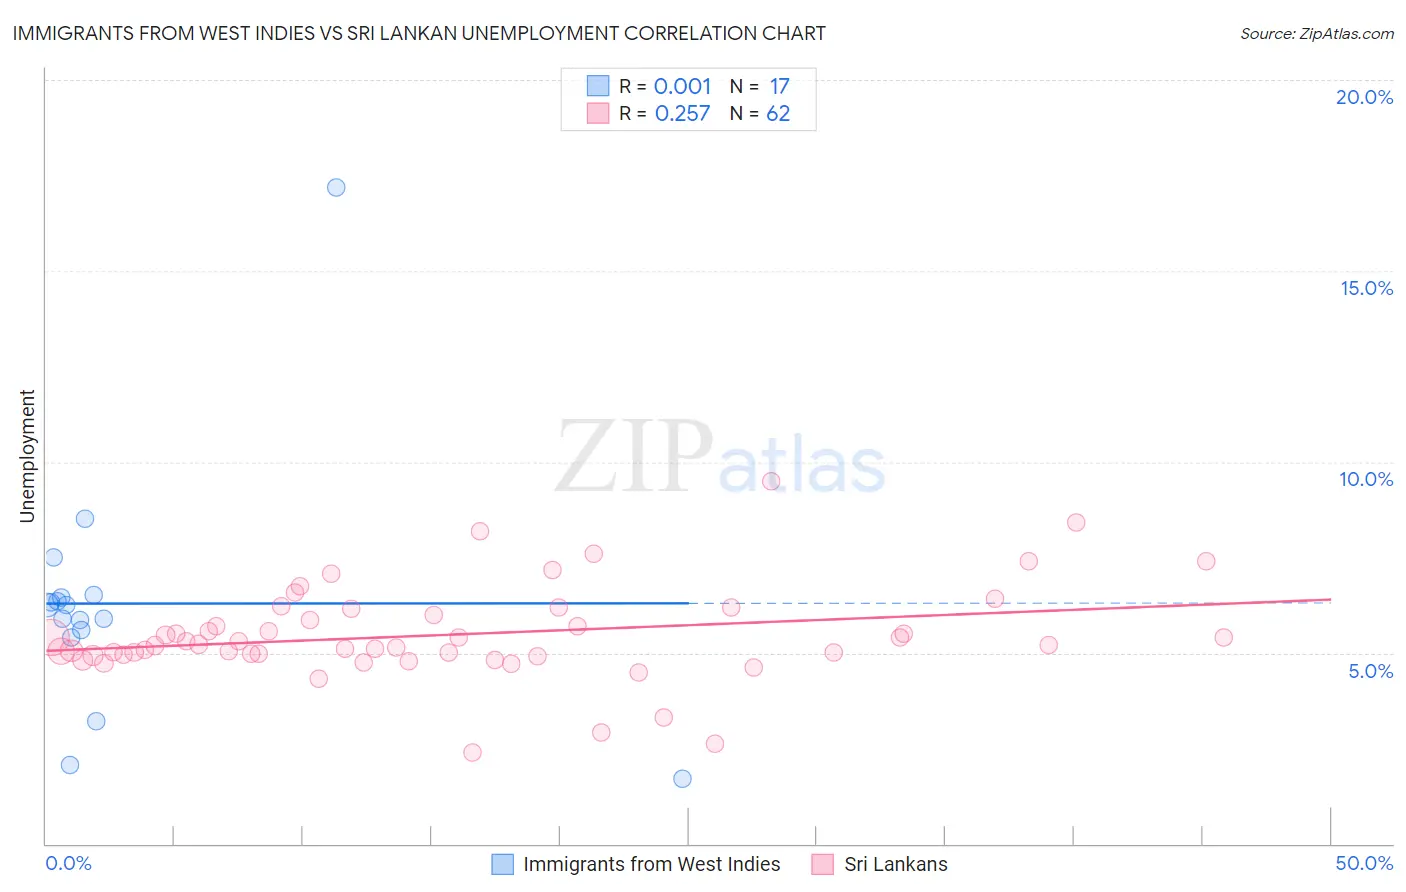
Immigrants from West Indies vs Sri Lankan Unemployment Correlation Chart
The statistical analysis conducted on geographies consisting of 72,442,388 people shows no correlation between the proportion of Immigrants from West Indies and unemployment in the United States with a correlation coefficient (R) of 0.001 and weighted average of 6.3%. Similarly, the statistical analysis conducted on geographies consisting of 440,052,205 people shows a weak positive correlation between the proportion of Sri Lankans and unemployment in the United States with a correlation coefficient (R) of 0.257 and weighted average of 5.2%, a difference of 21.5%.
Unemployment Correlation Summary
| Measurement | Immigrants from West Indies | Sri Lankan |
| Minimum | 1.7% | 2.4% |
| Maximum | 17.2% | 9.5% |
| Range | 15.5% | 7.1% |
| Mean | 6.3% | 5.5% |
| Median | 6.2% | 5.2% |
| Interquartile 25% (IQ1) | 5.5% | 5.0% |
| Interquartile 75% (IQ3) | 6.5% | 6.0% |
| Interquartile Range (IQR) | 0.97% | 1.0% |
| Standard Deviation (Sample) | 3.3% | 1.2% |
| Standard Deviation (Population) | 3.2% | 1.2% |
Similar Demographics by Unemployment
Demographics Similar to Immigrants from West Indies by Unemployment
In terms of unemployment, the demographic groups most similar to Immigrants from West Indies are Immigrants from Haiti (6.3%, a difference of 0.050%), Immigrants from Trinidad and Tobago (6.3%, a difference of 0.12%), Jamaican (6.3%, a difference of 0.14%), Ute (6.3%, a difference of 0.48%), and Trinidadian and Tobagonian (6.3%, a difference of 0.60%).
| Demographics | Rating | Rank | Unemployment |
| Central American Indians | 0.0 /100 | #292 | Tragic 6.2% |
| Immigrants | Ecuador | 0.0 /100 | #293 | Tragic 6.2% |
| Spanish American Indians | 0.0 /100 | #294 | Tragic 6.2% |
| U.S. Virgin Islanders | 0.0 /100 | #295 | Tragic 6.3% |
| Ute | 0.0 /100 | #296 | Tragic 6.3% |
| Jamaicans | 0.0 /100 | #297 | Tragic 6.3% |
| Immigrants | Haiti | 0.0 /100 | #298 | Tragic 6.3% |
| Immigrants | West Indies | 0.0 /100 | #299 | Tragic 6.3% |
| Immigrants | Trinidad and Tobago | 0.0 /100 | #300 | Tragic 6.3% |
| Trinidadians and Tobagonians | 0.0 /100 | #301 | Tragic 6.3% |
| West Indians | 0.0 /100 | #302 | Tragic 6.4% |
| Belizeans | 0.0 /100 | #303 | Tragic 6.4% |
| Immigrants | Jamaica | 0.0 /100 | #304 | Tragic 6.4% |
| Menominee | 0.0 /100 | #305 | Tragic 6.4% |
| Lumbee | 0.0 /100 | #306 | Tragic 6.4% |
Demographics Similar to Sri Lankans by Unemployment
In terms of unemployment, the demographic groups most similar to Sri Lankans are Immigrants from Kazakhstan (5.2%, a difference of 0.060%), Immigrants from Northern Africa (5.2%, a difference of 0.13%), Immigrants from Egypt (5.2%, a difference of 0.20%), Immigrants from Russia (5.2%, a difference of 0.20%), and Laotian (5.2%, a difference of 0.23%).
| Demographics | Rating | Rank | Unemployment |
| Potawatomi | 76.2 /100 | #150 | Good 5.2% |
| Immigrants | Eastern Europe | 75.3 /100 | #151 | Good 5.2% |
| Immigrants | Hong Kong | 75.2 /100 | #152 | Good 5.2% |
| Egyptians | 75.2 /100 | #153 | Good 5.2% |
| Immigrants | China | 74.7 /100 | #154 | Good 5.2% |
| Immigrants | Northern Africa | 71.3 /100 | #155 | Good 5.2% |
| Immigrants | Kazakhstan | 70.4 /100 | #156 | Good 5.2% |
| Sri Lankans | 69.5 /100 | #157 | Good 5.2% |
| Immigrants | Egypt | 66.7 /100 | #158 | Good 5.2% |
| Immigrants | Russia | 66.6 /100 | #159 | Good 5.2% |
| Laotians | 66.3 /100 | #160 | Good 5.2% |
| Immigrants | Oceania | 65.2 /100 | #161 | Good 5.2% |
| Spanish | 65.1 /100 | #162 | Good 5.2% |
| Immigrants | Zaire | 64.7 /100 | #163 | Good 5.2% |
| Immigrants | Colombia | 64.7 /100 | #164 | Good 5.2% |