Immigrants from West Indies vs Chinese Unemployment Among Ages 60 to 64 years
COMPARE
Immigrants from West Indies
Chinese
Unemployment Among Ages 60 to 64 years
Unemployment Among Ages 60 to 64 years Comparison
Immigrants from West Indies
Chinese
5.5%
UNEMPLOYMENT AMONG AGES 60 TO 64 YEARS
0.0/ 100
METRIC RATING
312th/ 347
METRIC RANK
4.0%
UNEMPLOYMENT AMONG AGES 60 TO 64 YEARS
100.0/ 100
METRIC RATING
3rd/ 347
METRIC RANK
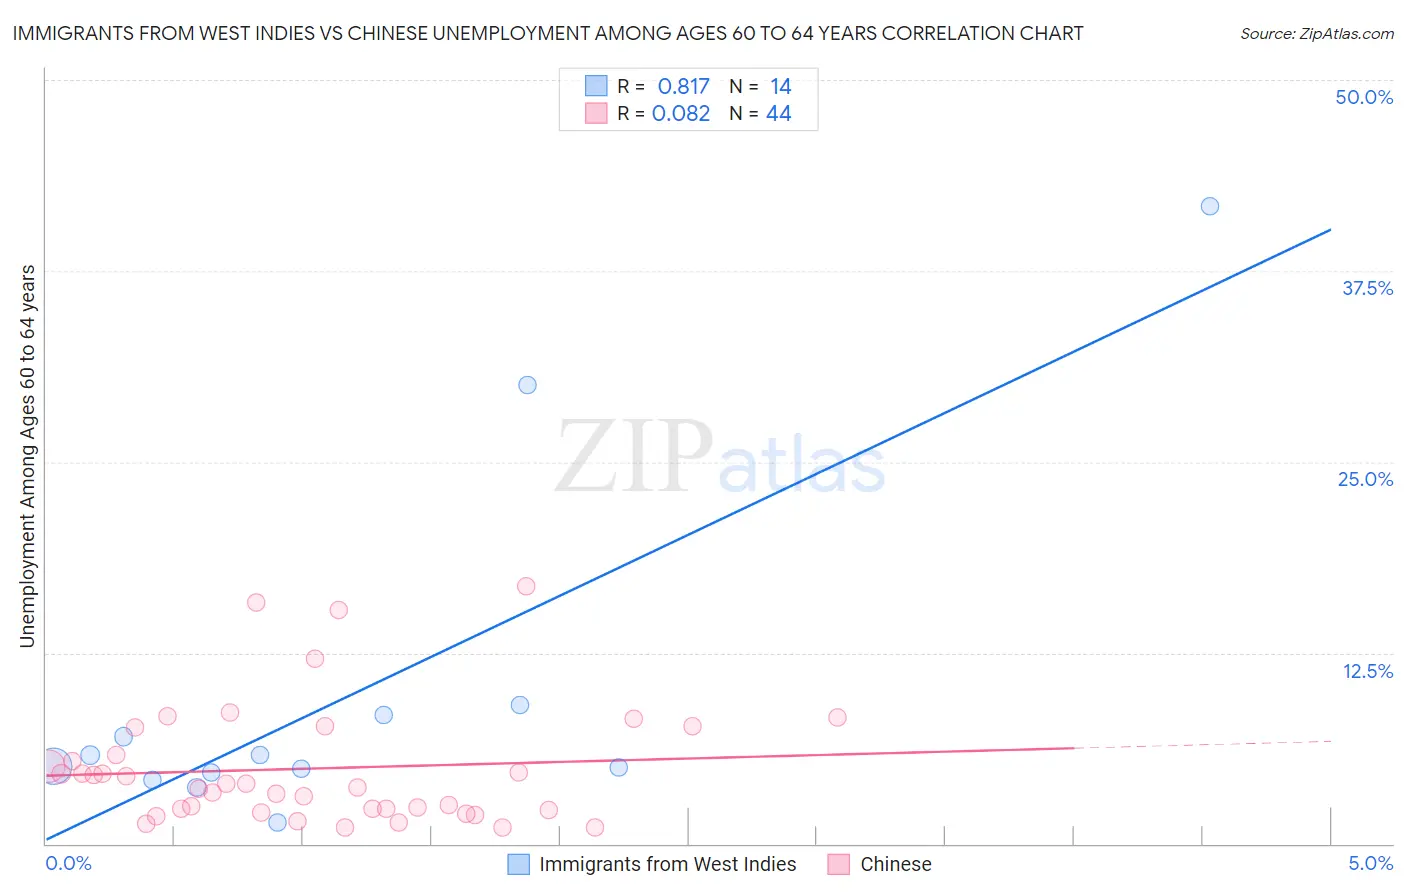
Immigrants from West Indies vs Chinese Unemployment Among Ages 60 to 64 years Correlation Chart
The statistical analysis conducted on geographies consisting of 71,195,820 people shows a very strong positive correlation between the proportion of Immigrants from West Indies and unemployment rate among population between the ages 60 and 64 in the United States with a correlation coefficient (R) of 0.817 and weighted average of 5.5%. Similarly, the statistical analysis conducted on geographies consisting of 62,952,421 people shows a slight positive correlation between the proportion of Chinese and unemployment rate among population between the ages 60 and 64 in the United States with a correlation coefficient (R) of 0.082 and weighted average of 4.0%, a difference of 36.8%.
Unemployment Among Ages 60 to 64 years Correlation Summary
| Measurement | Immigrants from West Indies | Chinese |
| Minimum | 1.4% | 1.1% |
| Maximum | 41.7% | 16.9% |
| Range | 40.3% | 15.8% |
| Mean | 9.8% | 4.9% |
| Median | 5.4% | 3.8% |
| Interquartile 25% (IQ1) | 4.7% | 2.2% |
| Interquartile 75% (IQ3) | 8.4% | 6.7% |
| Interquartile Range (IQR) | 3.8% | 4.4% |
| Standard Deviation (Sample) | 11.4% | 3.9% |
| Standard Deviation (Population) | 11.0% | 3.9% |
Similar Demographics by Unemployment Among Ages 60 to 64 years
Demographics Similar to Immigrants from West Indies by Unemployment Among Ages 60 to 64 years
In terms of unemployment among ages 60 to 64 years, the demographic groups most similar to Immigrants from West Indies are U.S. Virgin Islander (5.5%, a difference of 0.19%), British West Indian (5.5%, a difference of 0.20%), Belizean (5.5%, a difference of 0.70%), Guyanese (5.5%, a difference of 0.87%), and Soviet Union (5.4%, a difference of 1.1%).
| Demographics | Rating | Rank | Unemployment Among Ages 60 to 64 years |
| Cypriots | 0.0 /100 | #305 | Tragic 5.4% |
| Immigrants | Dominica | 0.0 /100 | #306 | Tragic 5.4% |
| Immigrants | Guyana | 0.0 /100 | #307 | Tragic 5.4% |
| Spanish American Indians | 0.0 /100 | #308 | Tragic 5.4% |
| Soviet Union | 0.0 /100 | #309 | Tragic 5.4% |
| British West Indians | 0.0 /100 | #310 | Tragic 5.5% |
| U.S. Virgin Islanders | 0.0 /100 | #311 | Tragic 5.5% |
| Immigrants | West Indies | 0.0 /100 | #312 | Tragic 5.5% |
| Belizeans | 0.0 /100 | #313 | Tragic 5.5% |
| Guyanese | 0.0 /100 | #314 | Tragic 5.5% |
| Cree | 0.0 /100 | #315 | Tragic 5.6% |
| Cheyenne | 0.0 /100 | #316 | Tragic 5.6% |
| Shoshone | 0.0 /100 | #317 | Tragic 5.7% |
| Natives/Alaskans | 0.0 /100 | #318 | Tragic 5.7% |
| Immigrants | Belize | 0.0 /100 | #319 | Tragic 5.7% |
Demographics Similar to Chinese by Unemployment Among Ages 60 to 64 years
In terms of unemployment among ages 60 to 64 years, the demographic groups most similar to Chinese are Hmong (4.0%, a difference of 0.42%), Immigrants from the Azores (4.0%, a difference of 0.43%), Fijian (3.9%, a difference of 2.9%), Immigrants from Congo (4.1%, a difference of 3.2%), and Lumbee (4.2%, a difference of 4.1%).
| Demographics | Rating | Rank | Unemployment Among Ages 60 to 64 years |
| Marshallese | 100.0 /100 | #1 | Exceptional 3.7% |
| Fijians | 100.0 /100 | #2 | Exceptional 3.9% |
| Chinese | 100.0 /100 | #3 | Exceptional 4.0% |
| Hmong | 100.0 /100 | #4 | Exceptional 4.0% |
| Immigrants | Azores | 100.0 /100 | #5 | Exceptional 4.0% |
| Immigrants | Congo | 100.0 /100 | #6 | Exceptional 4.1% |
| Lumbee | 100.0 /100 | #7 | Exceptional 4.2% |
| Immigrants | Micronesia | 100.0 /100 | #8 | Exceptional 4.2% |
| Indonesians | 100.0 /100 | #9 | Exceptional 4.2% |
| Immigrants | Bosnia and Herzegovina | 100.0 /100 | #10 | Exceptional 4.2% |
| Luxembourgers | 100.0 /100 | #11 | Exceptional 4.3% |
| Immigrants | Cuba | 100.0 /100 | #12 | Exceptional 4.3% |
| Chickasaw | 100.0 /100 | #13 | Exceptional 4.3% |
| Norwegians | 100.0 /100 | #14 | Exceptional 4.3% |
| Sudanese | 100.0 /100 | #15 | Exceptional 4.3% |