Immigrants from Vietnam vs Seminole Unemployment Among Ages 45 to 54 years
COMPARE
Immigrants from Vietnam
Seminole
Unemployment Among Ages 45 to 54 years
Unemployment Among Ages 45 to 54 years Comparison
Immigrants from Vietnam
Seminole
4.4%
UNEMPLOYMENT AMONG AGES 45 TO 54 YEARS
88.6/ 100
METRIC RATING
125th/ 347
METRIC RANK
4.8%
UNEMPLOYMENT AMONG AGES 45 TO 54 YEARS
1.1/ 100
METRIC RATING
244th/ 347
METRIC RANK
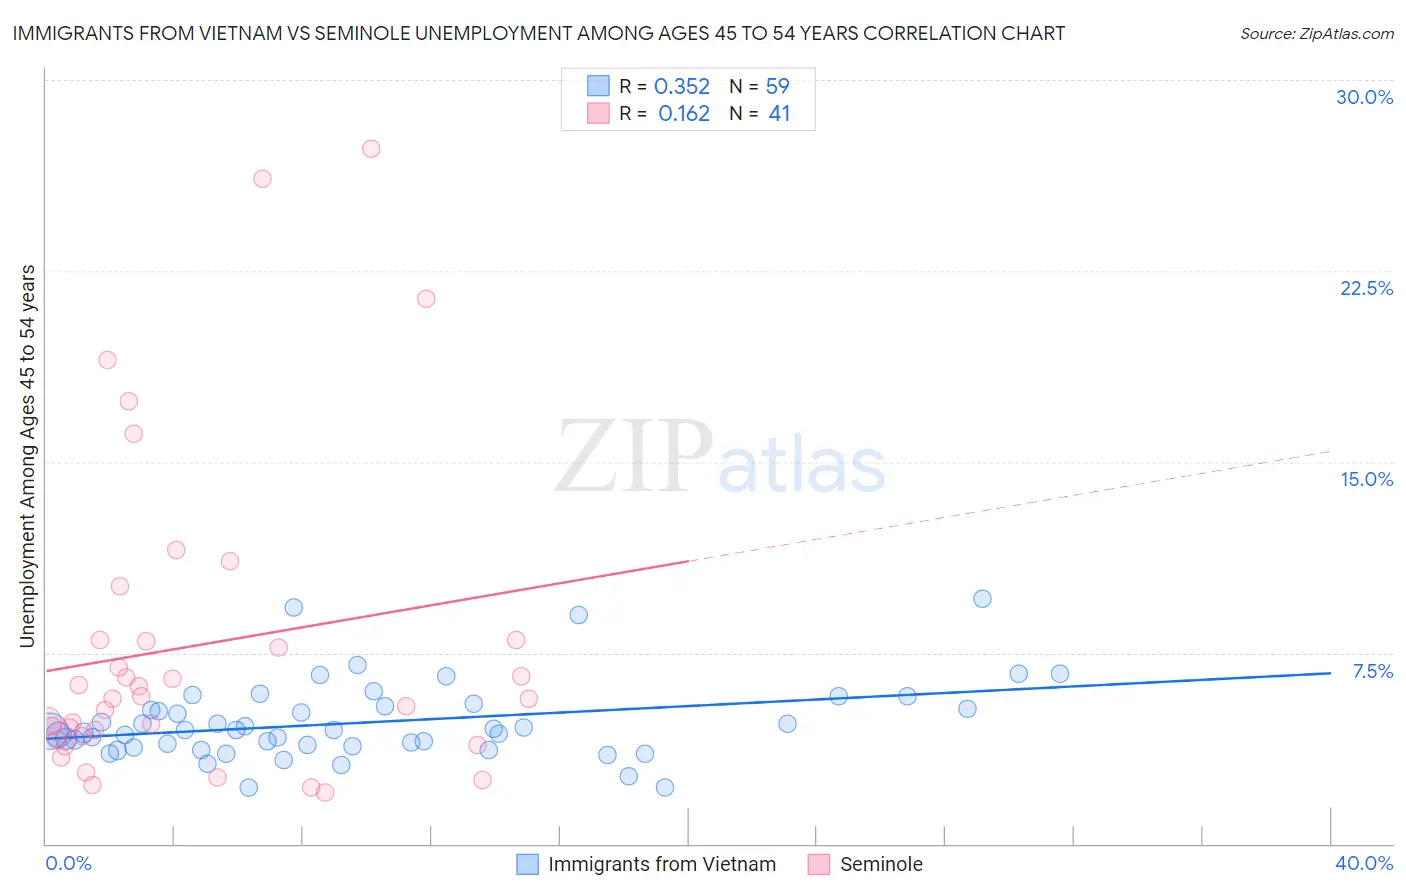
Immigrants from Vietnam vs Seminole Unemployment Among Ages 45 to 54 years Correlation Chart
The statistical analysis conducted on geographies consisting of 395,419,223 people shows a mild positive correlation between the proportion of Immigrants from Vietnam and unemployment rate among population between the ages 45 and 54 in the United States with a correlation coefficient (R) of 0.352 and weighted average of 4.4%. Similarly, the statistical analysis conducted on geographies consisting of 117,051,528 people shows a poor positive correlation between the proportion of Seminole and unemployment rate among population between the ages 45 and 54 in the United States with a correlation coefficient (R) of 0.162 and weighted average of 4.8%, a difference of 7.9%.
Unemployment Among Ages 45 to 54 years Correlation Summary
| Measurement | Immigrants from Vietnam | Seminole |
| Minimum | 2.2% | 2.0% |
| Maximum | 9.6% | 27.3% |
| Range | 7.4% | 25.3% |
| Mean | 4.8% | 7.8% |
| Median | 4.4% | 5.7% |
| Interquartile 25% (IQ1) | 3.8% | 4.2% |
| Interquartile 75% (IQ3) | 5.4% | 8.0% |
| Interquartile Range (IQR) | 1.6% | 3.8% |
| Standard Deviation (Sample) | 1.5% | 6.3% |
| Standard Deviation (Population) | 1.5% | 6.2% |
Similar Demographics by Unemployment Among Ages 45 to 54 years
Demographics Similar to Immigrants from Vietnam by Unemployment Among Ages 45 to 54 years
In terms of unemployment among ages 45 to 54 years, the demographic groups most similar to Immigrants from Vietnam are Immigrants from Asia (4.4%, a difference of 0.020%), Spanish (4.4%, a difference of 0.020%), Immigrants from Czechoslovakia (4.4%, a difference of 0.10%), Immigrants from Oceania (4.4%, a difference of 0.11%), and Immigrants from Kazakhstan (4.4%, a difference of 0.11%).
| Demographics | Rating | Rank | Unemployment Among Ages 45 to 54 years |
| Immigrants | Romania | 90.0 /100 | #118 | Exceptional 4.4% |
| Native Hawaiians | 90.0 /100 | #119 | Excellent 4.4% |
| Americans | 89.6 /100 | #120 | Excellent 4.4% |
| Immigrants | Oceania | 89.5 /100 | #121 | Excellent 4.4% |
| Immigrants | Kazakhstan | 89.5 /100 | #122 | Excellent 4.4% |
| Immigrants | Asia | 88.8 /100 | #123 | Excellent 4.4% |
| Spanish | 88.8 /100 | #124 | Excellent 4.4% |
| Immigrants | Vietnam | 88.6 /100 | #125 | Excellent 4.4% |
| Immigrants | Czechoslovakia | 87.8 /100 | #126 | Excellent 4.4% |
| Nicaraguans | 87.6 /100 | #127 | Excellent 4.4% |
| Immigrants | Northern Europe | 86.9 /100 | #128 | Excellent 4.4% |
| Laotians | 86.3 /100 | #129 | Excellent 4.4% |
| Celtics | 86.2 /100 | #130 | Excellent 4.4% |
| Immigrants | Germany | 85.9 /100 | #131 | Excellent 4.4% |
| Immigrants | Eastern Africa | 85.1 /100 | #132 | Excellent 4.4% |
Demographics Similar to Seminole by Unemployment Among Ages 45 to 54 years
In terms of unemployment among ages 45 to 54 years, the demographic groups most similar to Seminole are Portuguese (4.8%, a difference of 0.060%), Immigrants from Albania (4.8%, a difference of 0.15%), Immigrants from Syria (4.8%, a difference of 0.16%), Delaware (4.8%, a difference of 0.17%), and Central American (4.8%, a difference of 0.17%).
| Demographics | Rating | Rank | Unemployment Among Ages 45 to 54 years |
| Alsatians | 1.6 /100 | #237 | Tragic 4.7% |
| Yaqui | 1.4 /100 | #238 | Tragic 4.7% |
| Spanish Americans | 1.4 /100 | #239 | Tragic 4.7% |
| Immigrants | Iraq | 1.3 /100 | #240 | Tragic 4.7% |
| Delaware | 1.3 /100 | #241 | Tragic 4.8% |
| Central Americans | 1.3 /100 | #242 | Tragic 4.8% |
| Portuguese | 1.1 /100 | #243 | Tragic 4.8% |
| Seminole | 1.1 /100 | #244 | Tragic 4.8% |
| Immigrants | Albania | 0.9 /100 | #245 | Tragic 4.8% |
| Immigrants | Syria | 0.9 /100 | #246 | Tragic 4.8% |
| Israelis | 0.9 /100 | #247 | Tragic 4.8% |
| Immigrants | Liberia | 0.8 /100 | #248 | Tragic 4.8% |
| Immigrants | Honduras | 0.7 /100 | #249 | Tragic 4.8% |
| Salvadorans | 0.7 /100 | #250 | Tragic 4.8% |
| Hondurans | 0.4 /100 | #251 | Tragic 4.8% |