Immigrants from Vietnam vs Dutch Unemployment Among Ages 35 to 44 years
COMPARE
Immigrants from Vietnam
Dutch
Unemployment Among Ages 35 to 44 years
Unemployment Among Ages 35 to 44 years Comparison
Immigrants from Vietnam
Dutch
4.6%
UNEMPLOYMENT AMONG AGES 35 TO 44 YEARS
73.8/ 100
METRIC RATING
147th/ 347
METRIC RANK
4.4%
UNEMPLOYMENT AMONG AGES 35 TO 44 YEARS
96.1/ 100
METRIC RATING
77th/ 347
METRIC RANK
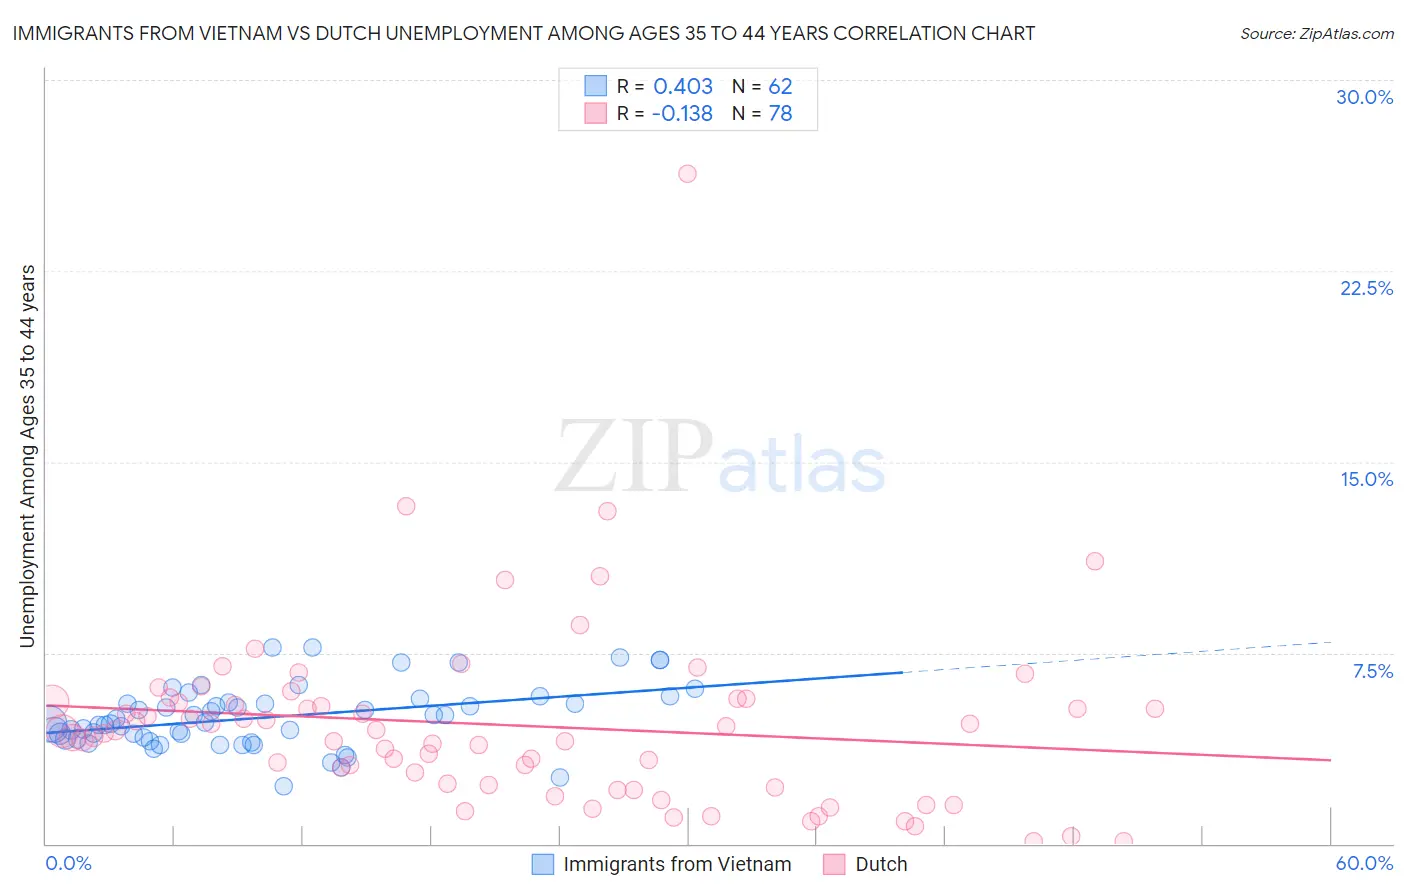
Immigrants from Vietnam vs Dutch Unemployment Among Ages 35 to 44 years Correlation Chart
The statistical analysis conducted on geographies consisting of 396,993,609 people shows a moderate positive correlation between the proportion of Immigrants from Vietnam and unemployment rate among population between the ages 35 and 44 in the United States with a correlation coefficient (R) of 0.403 and weighted average of 4.6%. Similarly, the statistical analysis conducted on geographies consisting of 518,885,936 people shows a poor negative correlation between the proportion of Dutch and unemployment rate among population between the ages 35 and 44 in the United States with a correlation coefficient (R) of -0.138 and weighted average of 4.4%, a difference of 4.1%.
Unemployment Among Ages 35 to 44 years Correlation Summary
| Measurement | Immigrants from Vietnam | Dutch |
| Minimum | 2.2% | 0.10% |
| Maximum | 7.7% | 26.3% |
| Range | 5.5% | 26.2% |
| Mean | 5.0% | 4.7% |
| Median | 4.7% | 4.4% |
| Interquartile 25% (IQ1) | 4.1% | 2.3% |
| Interquartile 75% (IQ3) | 5.6% | 5.6% |
| Interquartile Range (IQR) | 1.4% | 3.2% |
| Standard Deviation (Sample) | 1.2% | 3.7% |
| Standard Deviation (Population) | 1.2% | 3.7% |
Similar Demographics by Unemployment Among Ages 35 to 44 years
Demographics Similar to Immigrants from Vietnam by Unemployment Among Ages 35 to 44 years
In terms of unemployment among ages 35 to 44 years, the demographic groups most similar to Immigrants from Vietnam are Immigrants from Denmark (4.6%, a difference of 0.060%), Immigrants from Eastern Europe (4.6%, a difference of 0.080%), Slavic (4.6%, a difference of 0.12%), Immigrants from Burma/Myanmar (4.6%, a difference of 0.14%), and Immigrants from Switzerland (4.6%, a difference of 0.16%).
| Demographics | Rating | Rank | Unemployment Among Ages 35 to 44 years |
| Immigrants | Eastern Africa | 76.0 /100 | #140 | Good 4.6% |
| Canadians | 75.9 /100 | #141 | Good 4.6% |
| Ukrainians | 75.8 /100 | #142 | Good 4.6% |
| Immigrants | Switzerland | 75.5 /100 | #143 | Good 4.6% |
| Immigrants | Russia | 75.4 /100 | #144 | Good 4.6% |
| Immigrants | Eastern Europe | 74.7 /100 | #145 | Good 4.6% |
| Immigrants | Denmark | 74.4 /100 | #146 | Good 4.6% |
| Immigrants | Vietnam | 73.8 /100 | #147 | Good 4.6% |
| Slavs | 72.4 /100 | #148 | Good 4.6% |
| Immigrants | Burma/Myanmar | 72.2 /100 | #149 | Good 4.6% |
| Immigrants | England | 70.5 /100 | #150 | Good 4.6% |
| Puget Sound Salish | 67.1 /100 | #151 | Good 4.6% |
| Pakistanis | 67.1 /100 | #152 | Good 4.6% |
| Immigrants | Brazil | 67.0 /100 | #153 | Good 4.6% |
| Immigrants | Western Europe | 65.5 /100 | #154 | Good 4.6% |
Demographics Similar to Dutch by Unemployment Among Ages 35 to 44 years
In terms of unemployment among ages 35 to 44 years, the demographic groups most similar to Dutch are Indian (Asian) (4.4%, a difference of 0.060%), Immigrants from Jordan (4.4%, a difference of 0.080%), Immigrants from Romania (4.4%, a difference of 0.11%), Immigrants from Sweden (4.4%, a difference of 0.11%), and Polish (4.4%, a difference of 0.14%).
| Demographics | Rating | Rank | Unemployment Among Ages 35 to 44 years |
| Immigrants | China | 96.7 /100 | #70 | Exceptional 4.4% |
| Immigrants | Lithuania | 96.7 /100 | #71 | Exceptional 4.4% |
| Northern Europeans | 96.5 /100 | #72 | Exceptional 4.4% |
| Lithuanians | 96.5 /100 | #73 | Exceptional 4.4% |
| Poles | 96.4 /100 | #74 | Exceptional 4.4% |
| Immigrants | Romania | 96.3 /100 | #75 | Exceptional 4.4% |
| Immigrants | Jordan | 96.3 /100 | #76 | Exceptional 4.4% |
| Dutch | 96.1 /100 | #77 | Exceptional 4.4% |
| Indians (Asian) | 96.0 /100 | #78 | Exceptional 4.4% |
| Immigrants | Sweden | 95.9 /100 | #79 | Exceptional 4.4% |
| Kenyans | 95.7 /100 | #80 | Exceptional 4.4% |
| Immigrants | Scotland | 95.6 /100 | #81 | Exceptional 4.4% |
| Immigrants | Asia | 95.6 /100 | #82 | Exceptional 4.4% |
| Immigrants | Australia | 95.3 /100 | #83 | Exceptional 4.4% |
| Immigrants | Chile | 95.2 /100 | #84 | Exceptional 4.4% |