Immigrants from Venezuela vs Immigrants from Thailand Unemployment Among Ages 55 to 59 years

COMPARE

Immigrants from Venezuela
Race
Ancestry
AfghanAfricanAlaska NativeAlaskan AthabascanAlbanianAleutAlsatianAmericanApacheArabArapahoArgentineanArmenianAssyrian/Chaldean/SyriacAustralianAustrianBahamianBangladeshiBarbadianBasqueBelgianBelizeanBermudanBhutaneseBlackfeetBolivianBrazilianBritishBritish West IndianBulgarianBurmeseCajunCambodianCanadianCape VerdeanCarpatho RusynCelticCentral AmericanCentral American IndianCherokeeCheyenneChickasawChileanChineseChippewaChoctawColombianColvilleComancheCosta RicanCreeCreekCroatianCrowCubanCypriotCzechCzechoslovakianDanishDelawareDominicanDutchDutch West IndianEastern EuropeanEcuadorianEgyptianEnglishEstonianEthiopianEuropeanFijianFilipinoFinnishFrenchFrench American IndianFrench CanadianGermanGerman RussianGhanaianGreekGuamanian/ChamorroGuatemalanGuyaneseHaitianHmongHonduranHopiHoumaHungarianIcelanderIndian (Asian)IndonesianInupiatIranianIraqiIrishIroquoisIsraeliItalianJamaicanJapaneseJordanianKenyanKiowaKoreanLaotianLatvianLebaneseLiberianLithuanianLumbeeLuxembourgerMacedonianMalaysianMalteseMarshalleseMenomineeMexicanMexican American IndianMongolianMoroccanNative HawaiianNavajoNepaleseNew ZealanderNicaraguanNigerianNorthern EuropeanNorwegianOkinawanOsageOttawaPaiutePakistaniPalestinianPanamanianParaguayanPennsylvania GermanPeruvianPimaPolishPortuguesePotawatomiPuebloPuerto RicanPuget Sound SalishRomanianRussianSalvadoranSamoanScandinavianScotch-IrishScottishSeminoleSenegaleseSerbianShoshoneSierra LeoneanSiouxSlavicSlovakSloveneSomaliSouth AfricanSouth AmericanSouth American IndianSoviet UnionSpaniardSpanishSpanish AmericanSpanish American IndianSri LankanSubsaharan AfricanSudaneseSwedishSwissSyrianTaiwaneseThaiTlingit-HaidaTohono O'OdhamTonganTrinidadian and TobagonianTsimshianTurkishU.S. Virgin IslanderUgandanUkrainianUruguayanUteVenezuelanVietnameseWelshWest IndianYakamaYaquiYugoslavianYumanYup'ikZimbabwean
Immigration
NonimmigrantsImmigrantsAfghanistanAfricaAlbaniaArgentinaArmeniaAsiaAustraliaAustriaBahamasBangladeshBarbadosBelarusBelgiumBelizeBoliviaBosnia and HerzegovinaBrazilBulgariaBurma/MyanmarCabo VerdeCambodiaCameroonCanadaCaribbeanCentral AmericaChileChinaColombiaCongoCosta RicaCroatiaCubaCzechoslovakiaDenmarkDominicaDominican RepublicEastern AfricaEastern AsiaEastern EuropeEcuadorEgyptEl SalvadorEnglandEritreaEthiopiaEuropeFijiFranceGermanyGhanaGreeceGrenadaGuatemalaGuyanaHaitiHondurasHong KongHungaryIndiaIndonesiaIranIraqIrelandIsraelItalyJamaicaJapanJordanKazakhstanKenyaKoreaKuwaitLaosLatin AmericaLatviaLebanonLiberiaLithuaniaMalaysiaMexicoMicronesiaMiddle AfricaMoldovaMoroccoNepalNetherlandsNicaraguaNigeriaNorth AmericaNorth MacedoniaNorthern AfricaNorthern EuropeNorwayOceaniaPakistanPanamaPeruPhilippinesPolandPortugalRomaniaRussiaSaudi ArabiaScotlandSenegalSerbiaSierra LeoneSingaporeSomaliaSouth AfricaSouth AmericaSouth Central AsiaSouth Eastern AsiaSouthern EuropeSpainSri LankaSt. Vincent and the GrenadinesSudanSwedenSwitzerlandSyriaTaiwanTrinidad and TobagoTurkeyUgandaUkraineUruguayUzbekistanVenezuelaVietnamWest IndiesWestern AfricaWestern AsiaWestern EuropeYemenZaireZimbabweAzores
Immigrants from Thailand
Race
Ancestry
AfghanAfricanAlaska NativeAlaskan AthabascanAlbanianAleutAlsatianAmericanApacheArabArapahoArgentineanArmenianAssyrian/Chaldean/SyriacAustralianAustrianBahamianBangladeshiBarbadianBasqueBelgianBelizeanBermudanBhutaneseBlackfeetBolivianBrazilianBritishBritish West IndianBulgarianBurmeseCajunCambodianCanadianCape VerdeanCarpatho RusynCelticCentral AmericanCentral American IndianCherokeeCheyenneChickasawChileanChineseChippewaChoctawColombianColvilleComancheCosta RicanCreeCreekCroatianCrowCubanCypriotCzechCzechoslovakianDanishDelawareDominicanDutchDutch West IndianEastern EuropeanEcuadorianEgyptianEnglishEstonianEthiopianEuropeanFijianFilipinoFinnishFrenchFrench American IndianFrench CanadianGermanGerman RussianGhanaianGreekGuamanian/ChamorroGuatemalanGuyaneseHaitianHmongHonduranHopiHoumaHungarianIcelanderIndian (Asian)IndonesianInupiatIranianIraqiIrishIroquoisIsraeliItalianJamaicanJapaneseJordanianKenyanKiowaKoreanLaotianLatvianLebaneseLiberianLithuanianLumbeeLuxembourgerMacedonianMalaysianMalteseMarshalleseMenomineeMexicanMexican American IndianMongolianMoroccanNative HawaiianNavajoNepaleseNew ZealanderNicaraguanNigerianNorthern EuropeanNorwegianOkinawanOsageOttawaPaiutePakistaniPalestinianPanamanianParaguayanPennsylvania GermanPeruvianPimaPolishPortuguesePotawatomiPuebloPuerto RicanPuget Sound SalishRomanianRussianSalvadoranSamoanScandinavianScotch-IrishScottishSeminoleSenegaleseSerbianShoshoneSierra LeoneanSiouxSlavicSlovakSloveneSomaliSouth AfricanSouth AmericanSouth American IndianSoviet UnionSpaniardSpanishSpanish AmericanSpanish American IndianSri LankanSubsaharan AfricanSudaneseSwedishSwissSyrianTaiwaneseThaiTlingit-HaidaTohono O'OdhamTonganTrinidadian and TobagonianTsimshianTurkishU.S. Virgin IslanderUgandanUkrainianUruguayanUteVenezuelanVietnameseWelshWest IndianYakamaYaquiYugoslavianYumanYup'ikZimbabwean
Immigration
NonimmigrantsImmigrantsAfghanistanAfricaAlbaniaArgentinaArmeniaAsiaAustraliaAustriaBahamasBangladeshBarbadosBelarusBelgiumBelizeBoliviaBosnia and HerzegovinaBrazilBulgariaBurma/MyanmarCabo VerdeCambodiaCameroonCanadaCaribbeanCentral AmericaChileChinaColombiaCongoCosta RicaCroatiaCubaCzechoslovakiaDenmarkDominicaDominican RepublicEastern AfricaEastern AsiaEastern EuropeEcuadorEgyptEl SalvadorEnglandEritreaEthiopiaEuropeFijiFranceGermanyGhanaGreeceGrenadaGuatemalaGuyanaHaitiHondurasHong KongHungaryIndiaIndonesiaIranIraqIrelandIsraelItalyJamaicaJapanJordanKazakhstanKenyaKoreaKuwaitLaosLatin AmericaLatviaLebanonLiberiaLithuaniaMalaysiaMexicoMicronesiaMiddle AfricaMoldovaMoroccoNepalNetherlandsNicaraguaNigeriaNorth AmericaNorth MacedoniaNorthern AfricaNorthern EuropeNorwayOceaniaPakistanPanamaPeruPhilippinesPolandPortugalRomaniaRussiaSaudi ArabiaScotlandSenegalSerbiaSierra LeoneSingaporeSomaliaSouth AfricaSouth AmericaSouth Central AsiaSouth Eastern AsiaSouthern EuropeSpainSri LankaSt. Vincent and the GrenadinesSudanSwedenSwitzerlandSyriaTaiwanThailandTrinidad and TobagoTurkeyUgandaUkraineUruguayUzbekistanVietnamWest IndiesWestern AfricaWestern AsiaWestern EuropeYemenZaireZimbabweAzores
Unemployment Among Ages 55 to 59 years
Income
Poverty
Unemployment
Labor Participation
Family Structure
Vehicle Availability
Education Level
Disability

Unemployment Among Ages 55 to 59 years Comparison

Immigrants from Venezuela

Immigrants from Thailand

Exceptional
Excellent
4.1%
UNEMPLOYMENT AMONG AGES 55 TO 59 YEARS
100.0/ 100
METRIC RATING
3rd/ 347
METRIC RANK
4.7%
UNEMPLOYMENT AMONG AGES 55 TO 59 YEARS
85.4/ 100
METRIC RATING
131st/ 347
METRIC RANK

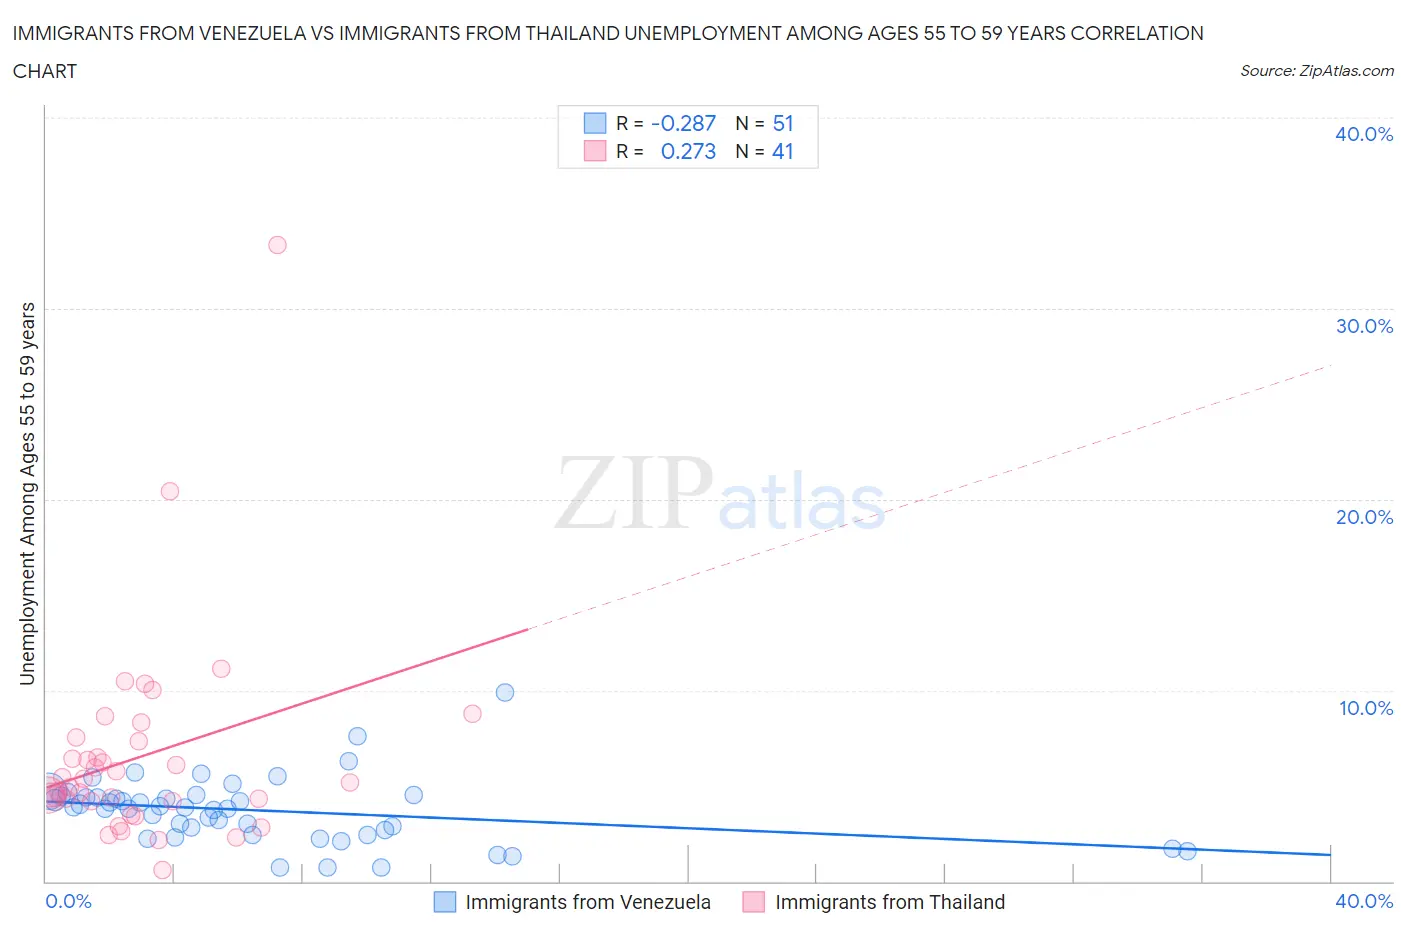
Immigrants from Venezuela vs Immigrants from Thailand Unemployment Among Ages 55 to 59 years Correlation Chart

The statistical analysis conducted on geographies consisting of 273,931,857 people shows a weak negative correlation between the proportion of Immigrants from Venezuela and unemployment rate among population between the ages 55 and 59 in the United States with a correlation coefficient (R) of -0.287 and weighted average of 4.1%. Similarly, the statistical analysis conducted on geographies consisting of 301,114,779 people shows a weak positive correlation between the proportion of Immigrants from Thailand and unemployment rate among population between the ages 55 and 59 in the United States with a correlation coefficient (R) of 0.273 and weighted average of 4.7%, a difference of 15.9%.
Immigrants from Venezuela vs Immigrants from Thailand Unemployment Among Ages 55 to 59 years

Unemployment Among Ages 55 to 59 years Correlation Summary

MeasurementImmigrants from VenezuelaImmigrants from Thailand
Minimum0.70%0.60%
Maximum9.9%33.3%
Range9.2%32.7%
Mean3.7%6.5%
Median3.9%5.2%
Interquartile 25% (IQ1)2.4%4.2%
Interquartile 75% (IQ3)4.5%7.4%
Interquartile Range (IQR)2.1%3.2%
Standard Deviation (Sample)1.7%5.5%
Standard Deviation (Population)1.7%5.4%

Similar Demographics by Unemployment Among Ages 55 to 59 years

Demographics Similar to Immigrants from Venezuela by Unemployment Among Ages 55 to 59 years

In terms of unemployment among ages 55 to 59 years, the demographic groups most similar to Immigrants from Venezuela are Immigrants from Cuba (4.1%, a difference of 0.0%), Fijian (4.1%, a difference of 0.31%), Venezuelan (4.2%, a difference of 1.9%), Immigrants from Bolivia (4.2%, a difference of 2.5%), and Norwegian (4.2%, a difference of 3.0%).
DemographicsRating | RankUnemployment Among Ages 55 to 59 years
Fijians
100.0
/100
|
#1
Exceptional
4.1%
Immigrants | Cuba
100.0
/100
|
#2
Exceptional
4.1%
Immigrants | Venezuela
100.0
/100
|
#3
Exceptional
4.1%
Venezuelans
100.0
/100
|
#4
Exceptional
4.2%
Immigrants | Bolivia
100.0
/100
|
#5
Exceptional
4.2%
Norwegians
100.0
/100
|
#6
Exceptional
4.2%
Zimbabweans
100.0
/100
|
#7
Exceptional
4.2%
Bolivians
100.0
/100
|
#8
Exceptional
4.2%
Cubans
100.0
/100
|
#9
Exceptional
4.2%
Tongans
100.0
/100
|
#10
Exceptional
4.3%
Immigrants | Congo
100.0
/100
|
#11
Exceptional
4.3%
Danes
100.0
/100
|
#12
Exceptional
4.3%
Indonesians
100.0
/100
|
#13
Exceptional
4.3%
Immigrants | India
100.0
/100
|
#14
Exceptional
4.3%
Bulgarians
100.0
/100
|
#15
Exceptional
4.3%

Demographics Similar to Immigrants from Thailand by Unemployment Among Ages 55 to 59 years

In terms of unemployment among ages 55 to 59 years, the demographic groups most similar to Immigrants from Thailand are Immigrants from Romania (4.7%, a difference of 0.010%), Immigrants from Netherlands (4.7%, a difference of 0.070%), Panamanian (4.7%, a difference of 0.10%), Greek (4.7%, a difference of 0.11%), and Immigrants from Sweden (4.7%, a difference of 0.12%).
DemographicsRating | RankUnemployment Among Ages 55 to 59 years
Lithuanians
88.8
/100
|
#124
Excellent
4.7%
Immigrants | Malaysia
87.9
/100
|
#125
Excellent
4.7%
Immigrants | Serbia
87.8
/100
|
#126
Excellent
4.7%
Icelanders
87.7
/100
|
#127
Excellent
4.7%
Pennsylvania Germans
87.1
/100
|
#128
Excellent
4.7%
Immigrants | Sweden
86.8
/100
|
#129
Excellent
4.7%
Greeks
86.6
/100
|
#130
Excellent
4.7%
Immigrants | Thailand
85.4
/100
|
#131
Excellent
4.7%
Immigrants | Romania
85.3
/100
|
#132
Excellent
4.7%
Immigrants | Netherlands
84.5
/100
|
#133
Excellent
4.7%
Panamanians
84.1
/100
|
#134
Excellent
4.7%
Slavs
83.7
/100
|
#135
Excellent
4.7%
Colombians
83.6
/100
|
#136
Excellent
4.7%
Delaware
83.6
/100
|
#137
Excellent
4.7%
Immigrants | Switzerland
82.9
/100
|
#138
Excellent
4.7%