Immigrants from Ukraine vs Immigrants from Haiti Unemployment Among Ages 20 to 24 years
COMPARE
Immigrants from Ukraine
Immigrants from Haiti
Unemployment Among Ages 20 to 24 years
Unemployment Among Ages 20 to 24 years Comparison
Immigrants from Ukraine
Immigrants from Haiti
10.6%
UNEMPLOYMENT AMONG AGES 20 TO 24 YEARS
3.3/ 100
METRIC RATING
235th/ 347
METRIC RANK
12.4%
UNEMPLOYMENT AMONG AGES 20 TO 24 YEARS
0.0/ 100
METRIC RATING
306th/ 347
METRIC RANK
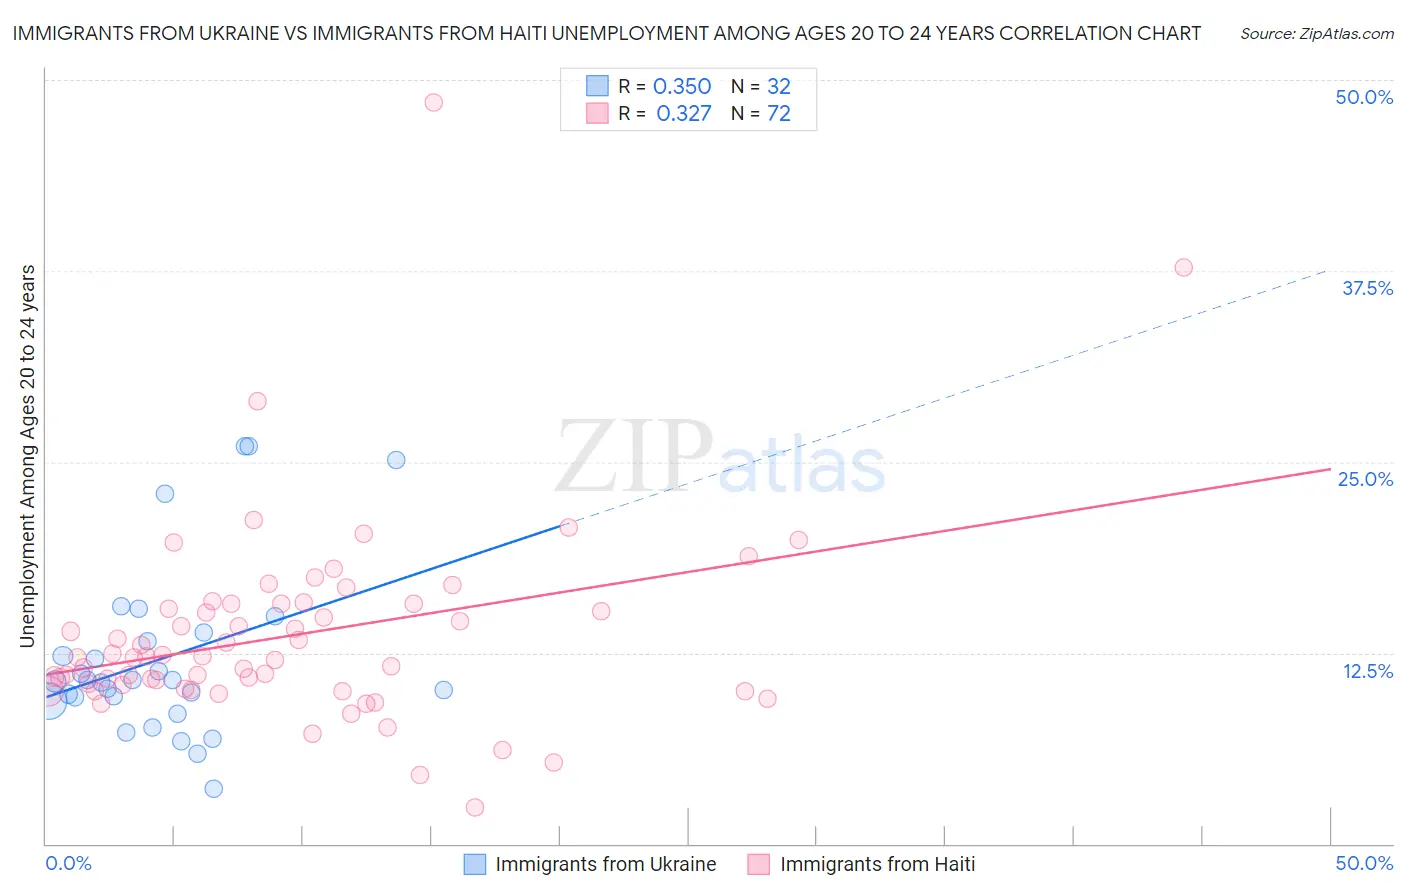
Immigrants from Ukraine vs Immigrants from Haiti Unemployment Among Ages 20 to 24 years Correlation Chart
The statistical analysis conducted on geographies consisting of 283,499,162 people shows a mild positive correlation between the proportion of Immigrants from Ukraine and unemployment rate among population between the ages 20 and 24 in the United States with a correlation coefficient (R) of 0.350 and weighted average of 10.6%. Similarly, the statistical analysis conducted on geographies consisting of 220,996,096 people shows a mild positive correlation between the proportion of Immigrants from Haiti and unemployment rate among population between the ages 20 and 24 in the United States with a correlation coefficient (R) of 0.327 and weighted average of 12.4%, a difference of 16.7%.
Unemployment Among Ages 20 to 24 years Correlation Summary
| Measurement | Immigrants from Ukraine | Immigrants from Haiti |
| Minimum | 3.6% | 2.4% |
| Maximum | 26.0% | 48.5% |
| Range | 22.4% | 46.1% |
| Mean | 12.1% | 13.7% |
| Median | 10.7% | 12.2% |
| Interquartile 25% (IQ1) | 9.5% | 10.3% |
| Interquartile 75% (IQ3) | 13.5% | 15.7% |
| Interquartile Range (IQR) | 4.1% | 5.5% |
| Standard Deviation (Sample) | 5.6% | 6.6% |
| Standard Deviation (Population) | 5.5% | 6.6% |
Similar Demographics by Unemployment Among Ages 20 to 24 years
Demographics Similar to Immigrants from Ukraine by Unemployment Among Ages 20 to 24 years
In terms of unemployment among ages 20 to 24 years, the demographic groups most similar to Immigrants from Ukraine are Mexican (10.6%, a difference of 0.040%), Immigrants from Africa (10.6%, a difference of 0.050%), Choctaw (10.6%, a difference of 0.060%), Israeli (10.6%, a difference of 0.090%), and Native Hawaiian (10.6%, a difference of 0.14%).
| Demographics | Rating | Rank | Unemployment Among Ages 20 to 24 years |
| Mexican American Indians | 4.6 /100 | #228 | Tragic 10.6% |
| Americans | 4.4 /100 | #229 | Tragic 10.6% |
| French American Indians | 4.1 /100 | #230 | Tragic 10.6% |
| Native Hawaiians | 3.9 /100 | #231 | Tragic 10.6% |
| Israelis | 3.7 /100 | #232 | Tragic 10.6% |
| Choctaw | 3.6 /100 | #233 | Tragic 10.6% |
| Immigrants | Africa | 3.5 /100 | #234 | Tragic 10.6% |
| Immigrants | Ukraine | 3.3 /100 | #235 | Tragic 10.6% |
| Mexicans | 3.2 /100 | #236 | Tragic 10.6% |
| Immigrants | Immigrants | 2.7 /100 | #237 | Tragic 10.6% |
| Immigrants | Pakistan | 2.6 /100 | #238 | Tragic 10.6% |
| Salvadorans | 2.4 /100 | #239 | Tragic 10.7% |
| Immigrants | Central America | 2.0 /100 | #240 | Tragic 10.7% |
| Immigrants | El Salvador | 1.7 /100 | #241 | Tragic 10.7% |
| Moroccans | 1.4 /100 | #242 | Tragic 10.7% |
Demographics Similar to Immigrants from Haiti by Unemployment Among Ages 20 to 24 years
In terms of unemployment among ages 20 to 24 years, the demographic groups most similar to Immigrants from Haiti are Bermudan (12.5%, a difference of 0.44%), Chippewa (12.3%, a difference of 0.84%), Immigrants from West Indies (12.3%, a difference of 0.88%), Tohono O'odham (12.5%, a difference of 1.1%), and Immigrants from Bangladesh (12.6%, a difference of 1.2%).
| Demographics | Rating | Rank | Unemployment Among Ages 20 to 24 years |
| Apache | 0.0 /100 | #299 | Tragic 12.0% |
| Spanish American Indians | 0.0 /100 | #300 | Tragic 12.1% |
| Immigrants | Sierra Leone | 0.0 /100 | #301 | Tragic 12.1% |
| Immigrants | Cabo Verde | 0.0 /100 | #302 | Tragic 12.2% |
| Haitians | 0.0 /100 | #303 | Tragic 12.2% |
| Immigrants | West Indies | 0.0 /100 | #304 | Tragic 12.3% |
| Chippewa | 0.0 /100 | #305 | Tragic 12.3% |
| Immigrants | Haiti | 0.0 /100 | #306 | Tragic 12.4% |
| Bermudans | 0.0 /100 | #307 | Tragic 12.5% |
| Tohono O'odham | 0.0 /100 | #308 | Tragic 12.5% |
| Immigrants | Bangladesh | 0.0 /100 | #309 | Tragic 12.6% |
| Jamaicans | 0.0 /100 | #310 | Tragic 12.6% |
| Vietnamese | 0.0 /100 | #311 | Tragic 12.6% |
| Houma | 0.0 /100 | #312 | Tragic 12.6% |
| Shoshone | 0.0 /100 | #313 | Tragic 12.7% |