Immigrants from Ukraine vs Eastern European Unemployment Among Ages 25 to 29 years
COMPARE
Immigrants from Ukraine
Eastern European
Unemployment Among Ages 25 to 29 years
Unemployment Among Ages 25 to 29 years Comparison
Immigrants from Ukraine
Eastern Europeans
6.7%
UNEMPLOYMENT AMONG AGES 25 TO 29 YEARS
28.6/ 100
METRIC RATING
192nd/ 347
METRIC RANK
6.5%
UNEMPLOYMENT AMONG AGES 25 TO 29 YEARS
74.1/ 100
METRIC RATING
137th/ 347
METRIC RANK
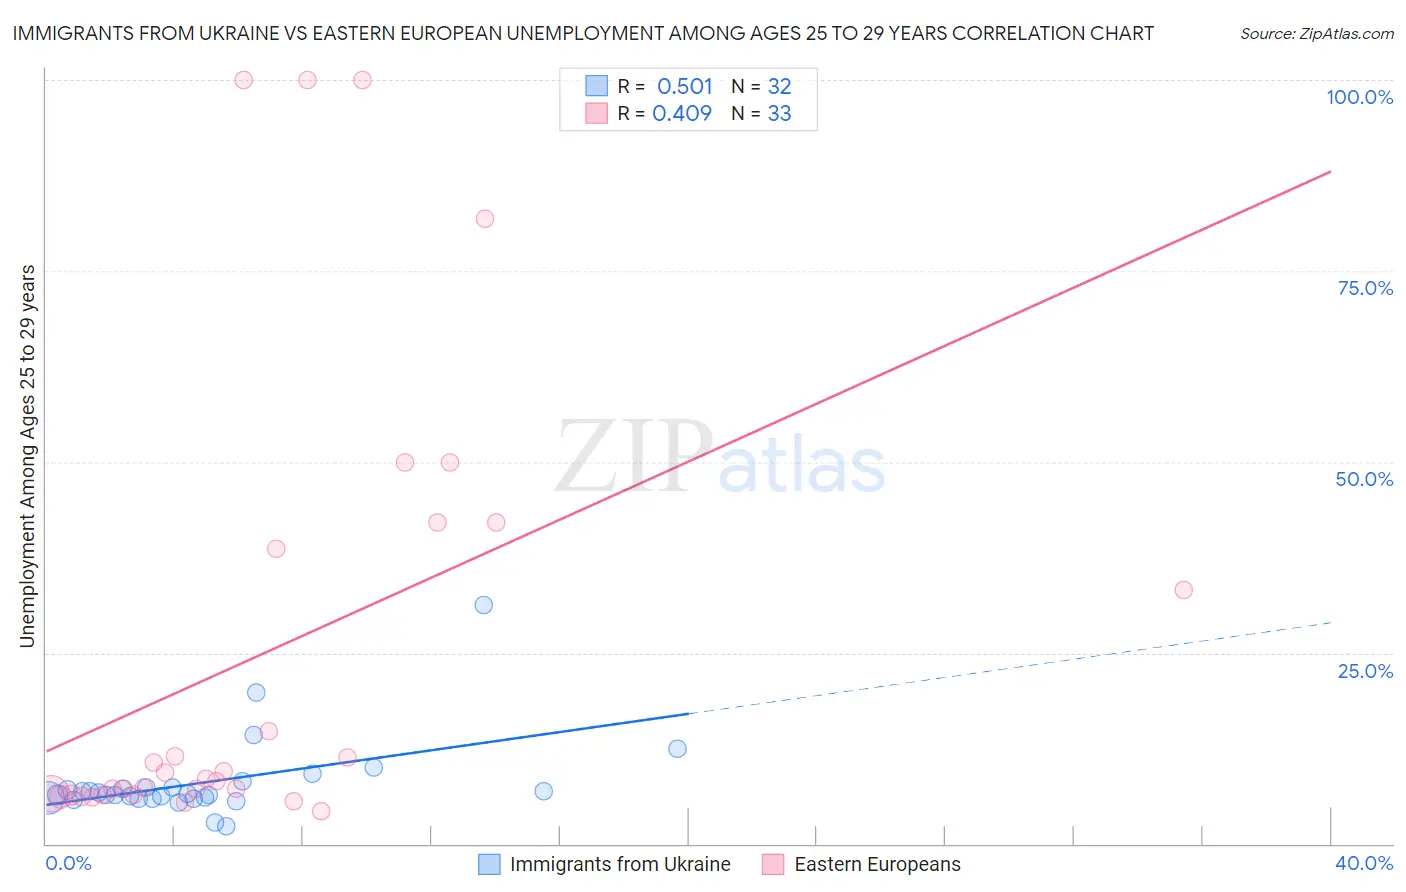
Immigrants from Ukraine vs Eastern European Unemployment Among Ages 25 to 29 years Correlation Chart
The statistical analysis conducted on geographies consisting of 279,034,601 people shows a substantial positive correlation between the proportion of Immigrants from Ukraine and unemployment rate among population between the ages 25 and 29 in the United States with a correlation coefficient (R) of 0.501 and weighted average of 6.7%. Similarly, the statistical analysis conducted on geographies consisting of 427,863,028 people shows a moderate positive correlation between the proportion of Eastern Europeans and unemployment rate among population between the ages 25 and 29 in the United States with a correlation coefficient (R) of 0.409 and weighted average of 6.5%, a difference of 3.1%.
Unemployment Among Ages 25 to 29 years Correlation Summary
| Measurement | Immigrants from Ukraine | Eastern European |
| Minimum | 2.3% | 4.3% |
| Maximum | 31.2% | 100.0% |
| Range | 28.9% | 95.7% |
| Mean | 8.0% | 24.8% |
| Median | 6.5% | 8.6% |
| Interquartile 25% (IQ1) | 6.0% | 6.4% |
| Interquartile 75% (IQ3) | 7.3% | 40.3% |
| Interquartile Range (IQR) | 1.3% | 33.9% |
| Standard Deviation (Sample) | 5.3% | 30.2% |
| Standard Deviation (Population) | 5.2% | 29.7% |
Similar Demographics by Unemployment Among Ages 25 to 29 years
Demographics Similar to Immigrants from Ukraine by Unemployment Among Ages 25 to 29 years
In terms of unemployment among ages 25 to 29 years, the demographic groups most similar to Immigrants from Ukraine are Chickasaw (6.7%, a difference of 0.010%), Alsatian (6.7%, a difference of 0.040%), Immigrants from Greece (6.7%, a difference of 0.040%), Korean (6.7%, a difference of 0.050%), and Immigrants from Western Asia (6.7%, a difference of 0.10%).
| Demographics | Rating | Rank | Unemployment Among Ages 25 to 29 years |
| Moroccans | 35.9 /100 | #185 | Fair 6.7% |
| Immigrants | Iran | 34.4 /100 | #186 | Fair 6.7% |
| Immigrants | South America | 33.0 /100 | #187 | Fair 6.7% |
| Irish | 32.8 /100 | #188 | Fair 6.7% |
| Argentineans | 32.1 /100 | #189 | Fair 6.7% |
| Koreans | 29.3 /100 | #190 | Fair 6.7% |
| Chickasaw | 28.7 /100 | #191 | Fair 6.7% |
| Immigrants | Ukraine | 28.6 /100 | #192 | Fair 6.7% |
| Alsatians | 28.1 /100 | #193 | Fair 6.7% |
| Immigrants | Greece | 28.0 /100 | #194 | Fair 6.7% |
| Immigrants | Western Asia | 27.3 /100 | #195 | Fair 6.7% |
| Hungarians | 26.8 /100 | #196 | Fair 6.8% |
| Italians | 26.5 /100 | #197 | Fair 6.8% |
| Immigrants | Southern Europe | 24.6 /100 | #198 | Fair 6.8% |
| Guamanians/Chamorros | 24.3 /100 | #199 | Fair 6.8% |
Demographics Similar to Eastern Europeans by Unemployment Among Ages 25 to 29 years
In terms of unemployment among ages 25 to 29 years, the demographic groups most similar to Eastern Europeans are Immigrants from Belgium (6.5%, a difference of 0.020%), Austrian (6.5%, a difference of 0.020%), Immigrants from Pakistan (6.5%, a difference of 0.020%), Maltese (6.5%, a difference of 0.090%), and Northern European (6.5%, a difference of 0.11%).
| Demographics | Rating | Rank | Unemployment Among Ages 25 to 29 years |
| Immigrants | Peru | 79.9 /100 | #130 | Good 6.5% |
| Immigrants | Afghanistan | 79.2 /100 | #131 | Good 6.5% |
| Poles | 76.6 /100 | #132 | Good 6.5% |
| Immigrants | Europe | 75.7 /100 | #133 | Good 6.5% |
| Immigrants | Vietnam | 75.6 /100 | #134 | Good 6.5% |
| Immigrants | Croatia | 75.5 /100 | #135 | Good 6.5% |
| Northern Europeans | 75.4 /100 | #136 | Good 6.5% |
| Eastern Europeans | 74.1 /100 | #137 | Good 6.5% |
| Immigrants | Belgium | 73.8 /100 | #138 | Good 6.5% |
| Austrians | 73.8 /100 | #139 | Good 6.5% |
| Immigrants | Pakistan | 73.8 /100 | #140 | Good 6.5% |
| Maltese | 72.9 /100 | #141 | Good 6.5% |
| Slavs | 72.5 /100 | #142 | Good 6.5% |
| Lithuanians | 72.2 /100 | #143 | Good 6.5% |
| Immigrants | Micronesia | 71.5 /100 | #144 | Good 6.6% |