Immigrants from Turkey vs American Unemployment Among Seniors over 75 years
COMPARE
Immigrants from Turkey
American
Unemployment Among Seniors over 75 years
Unemployment Among Seniors over 75 years Comparison
Immigrants from Turkey
Americans
8.0%
UNEMPLOYMENT AMONG SENIORS OVER 75 YEARS
99.8/ 100
METRIC RATING
77th/ 347
METRIC RANK
10.4%
UNEMPLOYMENT AMONG SENIORS OVER 75 YEARS
0.0/ 100
METRIC RATING
324th/ 347
METRIC RANK
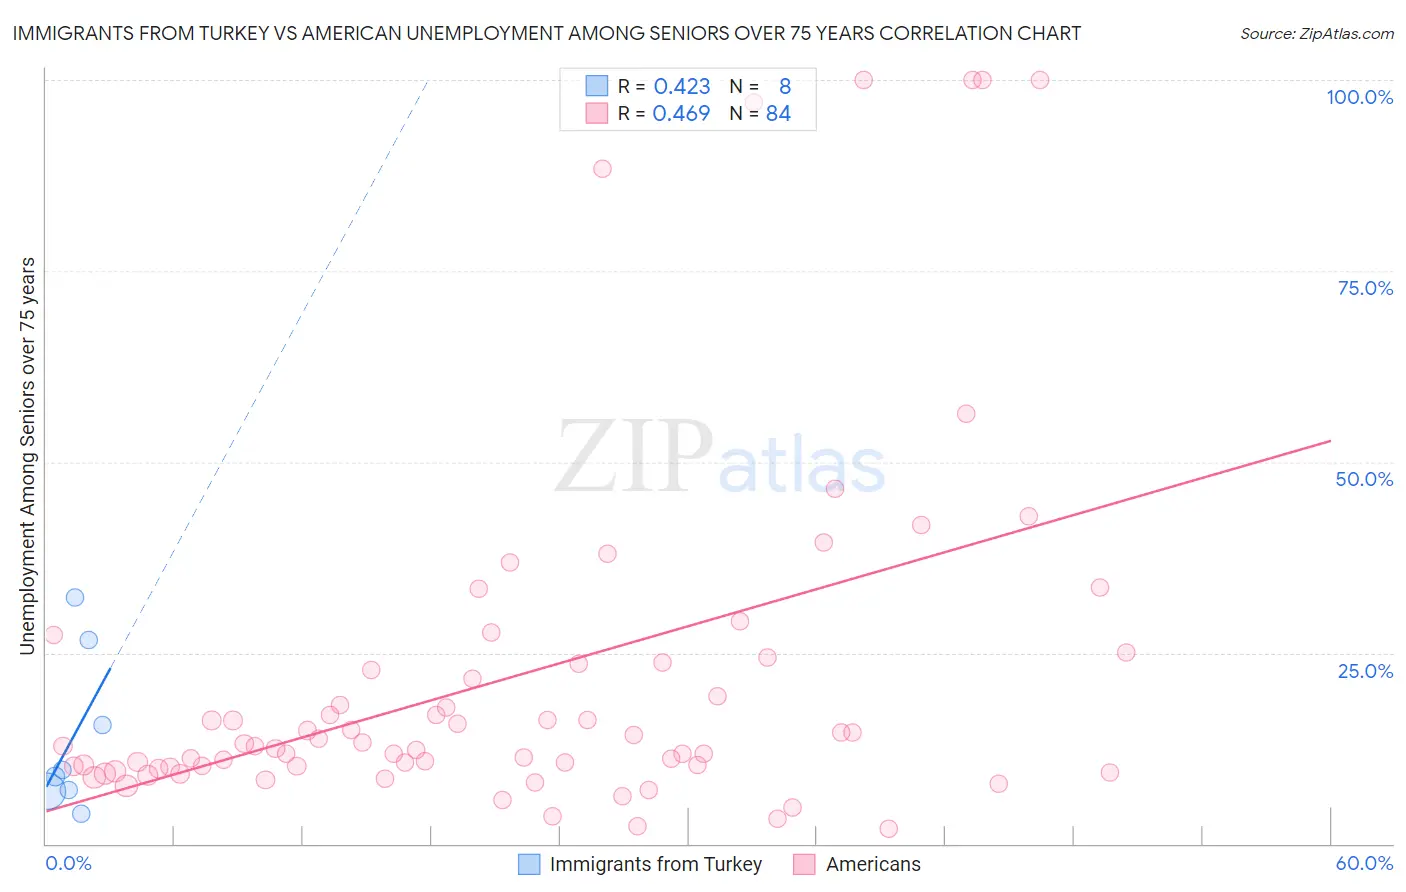
Immigrants from Turkey vs American Unemployment Among Seniors over 75 years Correlation Chart
The statistical analysis conducted on geographies consisting of 142,277,289 people shows a moderate positive correlation between the proportion of Immigrants from Turkey and unemployment rate among seniors over the age of 75 in the United States with a correlation coefficient (R) of 0.423 and weighted average of 8.0%. Similarly, the statistical analysis conducted on geographies consisting of 235,573,320 people shows a moderate positive correlation between the proportion of Americans and unemployment rate among seniors over the age of 75 in the United States with a correlation coefficient (R) of 0.469 and weighted average of 10.4%, a difference of 29.3%.
Unemployment Among Seniors over 75 years Correlation Summary
| Measurement | Immigrants from Turkey | American |
| Minimum | 3.9% | 1.9% |
| Maximum | 32.3% | 100.0% |
| Range | 28.3% | 98.1% |
| Mean | 13.8% | 22.0% |
| Median | 9.2% | 13.0% |
| Interquartile 25% (IQ1) | 6.9% | 10.1% |
| Interquartile 75% (IQ3) | 21.1% | 23.7% |
| Interquartile Range (IQR) | 14.2% | 13.6% |
| Standard Deviation (Sample) | 10.3% | 23.6% |
| Standard Deviation (Population) | 9.6% | 23.4% |
Similar Demographics by Unemployment Among Seniors over 75 years
Demographics Similar to Immigrants from Turkey by Unemployment Among Seniors over 75 years
In terms of unemployment among seniors over 75 years, the demographic groups most similar to Immigrants from Turkey are Immigrants from Belarus (8.0%, a difference of 0.030%), Immigrants from Venezuela (8.0%, a difference of 0.050%), Immigrants from Uganda (8.0%, a difference of 0.16%), Immigrants from Japan (8.0%, a difference of 0.24%), and Immigrants from Australia (8.0%, a difference of 0.25%).
| Demographics | Rating | Rank | Unemployment Among Seniors over 75 years |
| Immigrants | Argentina | 99.9 /100 | #70 | Exceptional 8.0% |
| Immigrants | Cambodia | 99.9 /100 | #71 | Exceptional 8.0% |
| Bolivians | 99.9 /100 | #72 | Exceptional 8.0% |
| Immigrants | France | 99.9 /100 | #73 | Exceptional 8.0% |
| Spanish Americans | 99.8 /100 | #74 | Exceptional 8.0% |
| Immigrants | Uganda | 99.8 /100 | #75 | Exceptional 8.0% |
| Immigrants | Venezuela | 99.8 /100 | #76 | Exceptional 8.0% |
| Immigrants | Turkey | 99.8 /100 | #77 | Exceptional 8.0% |
| Immigrants | Belarus | 99.8 /100 | #78 | Exceptional 8.0% |
| Immigrants | Japan | 99.7 /100 | #79 | Exceptional 8.0% |
| Immigrants | Australia | 99.7 /100 | #80 | Exceptional 8.0% |
| Cubans | 99.7 /100 | #81 | Exceptional 8.0% |
| Bhutanese | 99.7 /100 | #82 | Exceptional 8.0% |
| Arapaho | 99.7 /100 | #83 | Exceptional 8.1% |
| U.S. Virgin Islanders | 99.7 /100 | #84 | Exceptional 8.1% |
Demographics Similar to Americans by Unemployment Among Seniors over 75 years
In terms of unemployment among seniors over 75 years, the demographic groups most similar to Americans are Tongan (10.4%, a difference of 0.030%), Portuguese (10.4%, a difference of 0.20%), Slovak (10.4%, a difference of 0.43%), Dutch (10.4%, a difference of 0.51%), and Polish (10.3%, a difference of 0.67%).
| Demographics | Rating | Rank | Unemployment Among Seniors over 75 years |
| Irish | 0.0 /100 | #317 | Tragic 10.2% |
| Liberians | 0.0 /100 | #318 | Tragic 10.2% |
| Germans | 0.0 /100 | #319 | Tragic 10.3% |
| French | 0.0 /100 | #320 | Tragic 10.3% |
| Aleuts | 0.0 /100 | #321 | Tragic 10.3% |
| Poles | 0.0 /100 | #322 | Tragic 10.3% |
| Tongans | 0.0 /100 | #323 | Tragic 10.4% |
| Americans | 0.0 /100 | #324 | Tragic 10.4% |
| Portuguese | 0.0 /100 | #325 | Tragic 10.4% |
| Slovaks | 0.0 /100 | #326 | Tragic 10.4% |
| Dutch | 0.0 /100 | #327 | Tragic 10.4% |
| Immigrants | Portugal | 0.0 /100 | #328 | Tragic 10.5% |
| Tsimshian | 0.0 /100 | #329 | Tragic 10.5% |
| Immigrants | Azores | 0.0 /100 | #330 | Tragic 10.7% |
| Tohono O'odham | 0.0 /100 | #331 | Tragic 10.8% |