Immigrants from Trinidad and Tobago vs Immigrants from Zimbabwe Unemployment
COMPARE
Immigrants from Trinidad and Tobago
Immigrants from Zimbabwe
Unemployment
Unemployment Comparison
Immigrants from Trinidad and Tobago
Immigrants from Zimbabwe
6.3%
UNEMPLOYMENT
0.0/ 100
METRIC RATING
300th/ 347
METRIC RANK
4.9%
UNEMPLOYMENT
99.2/ 100
METRIC RATING
53rd/ 347
METRIC RANK
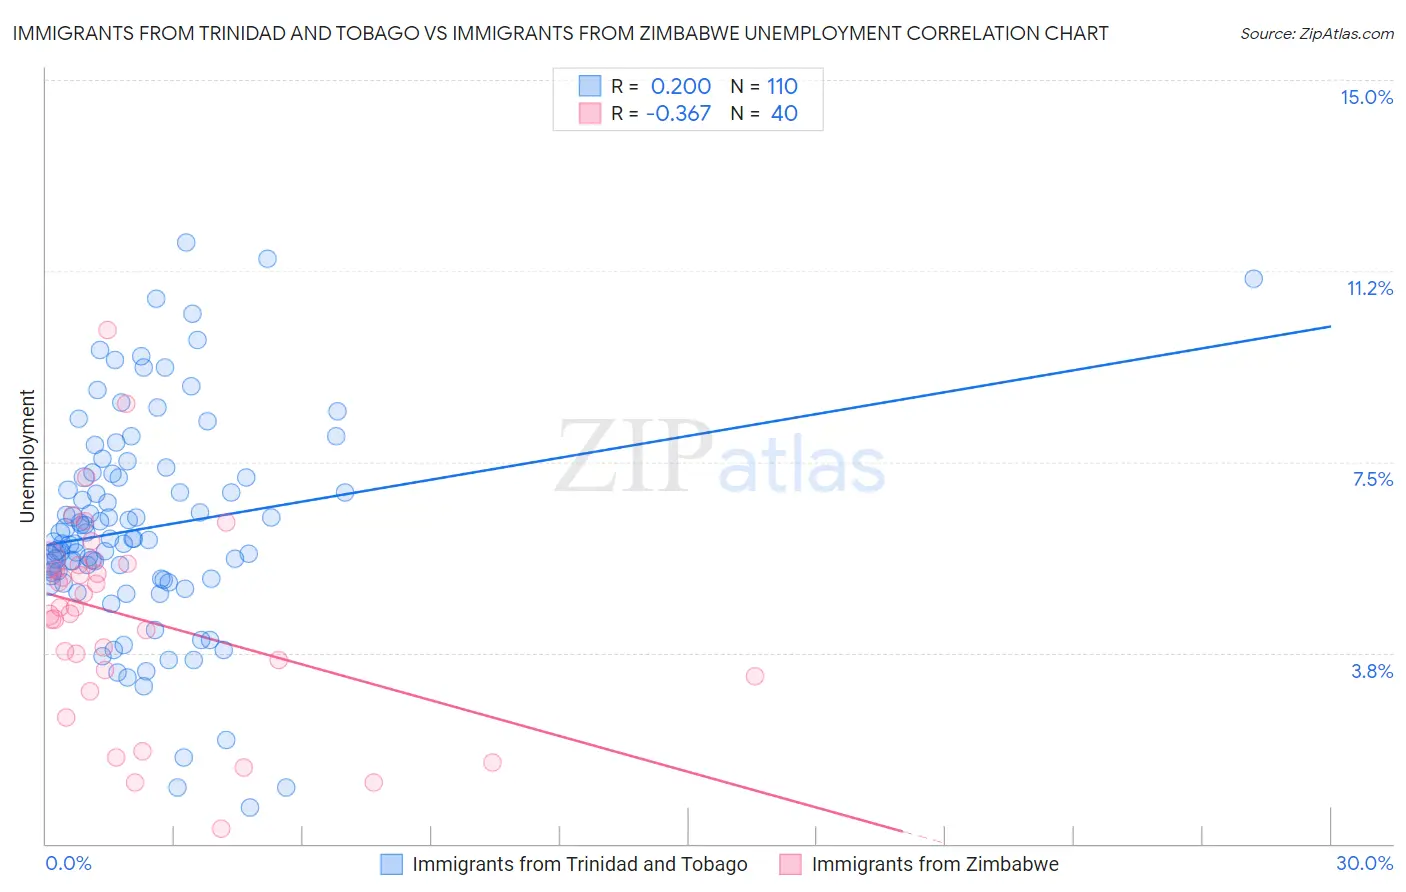
Immigrants from Trinidad and Tobago vs Immigrants from Zimbabwe Unemployment Correlation Chart
The statistical analysis conducted on geographies consisting of 223,333,177 people shows a weak positive correlation between the proportion of Immigrants from Trinidad and Tobago and unemployment in the United States with a correlation coefficient (R) of 0.200 and weighted average of 6.3%. Similarly, the statistical analysis conducted on geographies consisting of 117,788,083 people shows a mild negative correlation between the proportion of Immigrants from Zimbabwe and unemployment in the United States with a correlation coefficient (R) of -0.367 and weighted average of 4.9%, a difference of 29.7%.
Unemployment Correlation Summary
| Measurement | Immigrants from Trinidad and Tobago | Immigrants from Zimbabwe |
| Minimum | 0.70% | 0.30% |
| Maximum | 11.8% | 10.1% |
| Range | 11.1% | 9.8% |
| Mean | 6.2% | 4.4% |
| Median | 6.0% | 4.6% |
| Interquartile 25% (IQ1) | 5.2% | 3.4% |
| Interquartile 75% (IQ3) | 7.2% | 5.5% |
| Interquartile Range (IQR) | 2.0% | 2.1% |
| Standard Deviation (Sample) | 2.1% | 2.0% |
| Standard Deviation (Population) | 2.1% | 2.0% |
Similar Demographics by Unemployment
Demographics Similar to Immigrants from Trinidad and Tobago by Unemployment
In terms of unemployment, the demographic groups most similar to Immigrants from Trinidad and Tobago are Immigrants from West Indies (6.3%, a difference of 0.12%), Immigrants from Haiti (6.3%, a difference of 0.17%), Jamaican (6.3%, a difference of 0.26%), Trinidadian and Tobagonian (6.3%, a difference of 0.48%), and Ute (6.3%, a difference of 0.60%).
| Demographics | Rating | Rank | Unemployment |
| Immigrants | Ecuador | 0.0 /100 | #293 | Tragic 6.2% |
| Spanish American Indians | 0.0 /100 | #294 | Tragic 6.2% |
| U.S. Virgin Islanders | 0.0 /100 | #295 | Tragic 6.3% |
| Ute | 0.0 /100 | #296 | Tragic 6.3% |
| Jamaicans | 0.0 /100 | #297 | Tragic 6.3% |
| Immigrants | Haiti | 0.0 /100 | #298 | Tragic 6.3% |
| Immigrants | West Indies | 0.0 /100 | #299 | Tragic 6.3% |
| Immigrants | Trinidad and Tobago | 0.0 /100 | #300 | Tragic 6.3% |
| Trinidadians and Tobagonians | 0.0 /100 | #301 | Tragic 6.3% |
| West Indians | 0.0 /100 | #302 | Tragic 6.4% |
| Belizeans | 0.0 /100 | #303 | Tragic 6.4% |
| Immigrants | Jamaica | 0.0 /100 | #304 | Tragic 6.4% |
| Menominee | 0.0 /100 | #305 | Tragic 6.4% |
| Lumbee | 0.0 /100 | #306 | Tragic 6.4% |
| Immigrants | Bangladesh | 0.0 /100 | #307 | Tragic 6.5% |
Demographics Similar to Immigrants from Zimbabwe by Unemployment
In terms of unemployment, the demographic groups most similar to Immigrants from Zimbabwe are White/Caucasian (4.9%, a difference of 0.030%), Eastern European (4.9%, a difference of 0.030%), Immigrants from Belgium (4.9%, a difference of 0.040%), Australian (4.9%, a difference of 0.060%), and French Canadian (4.9%, a difference of 0.20%).
| Demographics | Rating | Rank | Unemployment |
| Immigrants | Nepal | 99.4 /100 | #46 | Exceptional 4.8% |
| Immigrants | Taiwan | 99.4 /100 | #47 | Exceptional 4.8% |
| Immigrants | Scotland | 99.3 /100 | #48 | Exceptional 4.9% |
| Immigrants | South Central Asia | 99.3 /100 | #49 | Exceptional 4.9% |
| French Canadians | 99.3 /100 | #50 | Exceptional 4.9% |
| Immigrants | Belgium | 99.2 /100 | #51 | Exceptional 4.9% |
| Whites/Caucasians | 99.2 /100 | #52 | Exceptional 4.9% |
| Immigrants | Zimbabwe | 99.2 /100 | #53 | Exceptional 4.9% |
| Eastern Europeans | 99.2 /100 | #54 | Exceptional 4.9% |
| Australians | 99.2 /100 | #55 | Exceptional 4.9% |
| Celtics | 99.1 /100 | #56 | Exceptional 4.9% |
| Immigrants | Singapore | 99.1 /100 | #57 | Exceptional 4.9% |
| Greeks | 99.0 /100 | #58 | Exceptional 4.9% |
| Bhutanese | 99.0 /100 | #59 | Exceptional 4.9% |
| Immigrants | Netherlands | 99.0 /100 | #60 | Exceptional 4.9% |