Immigrants from Trinidad and Tobago vs Immigrants from West Indies Unemployment Among Women with Children Under 6 years
COMPARE
Immigrants from Trinidad and Tobago
Immigrants from West Indies
Unemployment Among Women with Children Under 6 years
Unemployment Among Women with Children Under 6 years Comparison
Immigrants from Trinidad and Tobago
Immigrants from West Indies
8.0%
UNEMPLOYMENT AMONG WOMEN WITH CHILDREN UNDER 6 YEARS
4.8/ 100
METRIC RATING
233rd/ 347
METRIC RANK
9.0%
UNEMPLOYMENT AMONG WOMEN WITH CHILDREN UNDER 6 YEARS
0.0/ 100
METRIC RATING
303rd/ 347
METRIC RANK
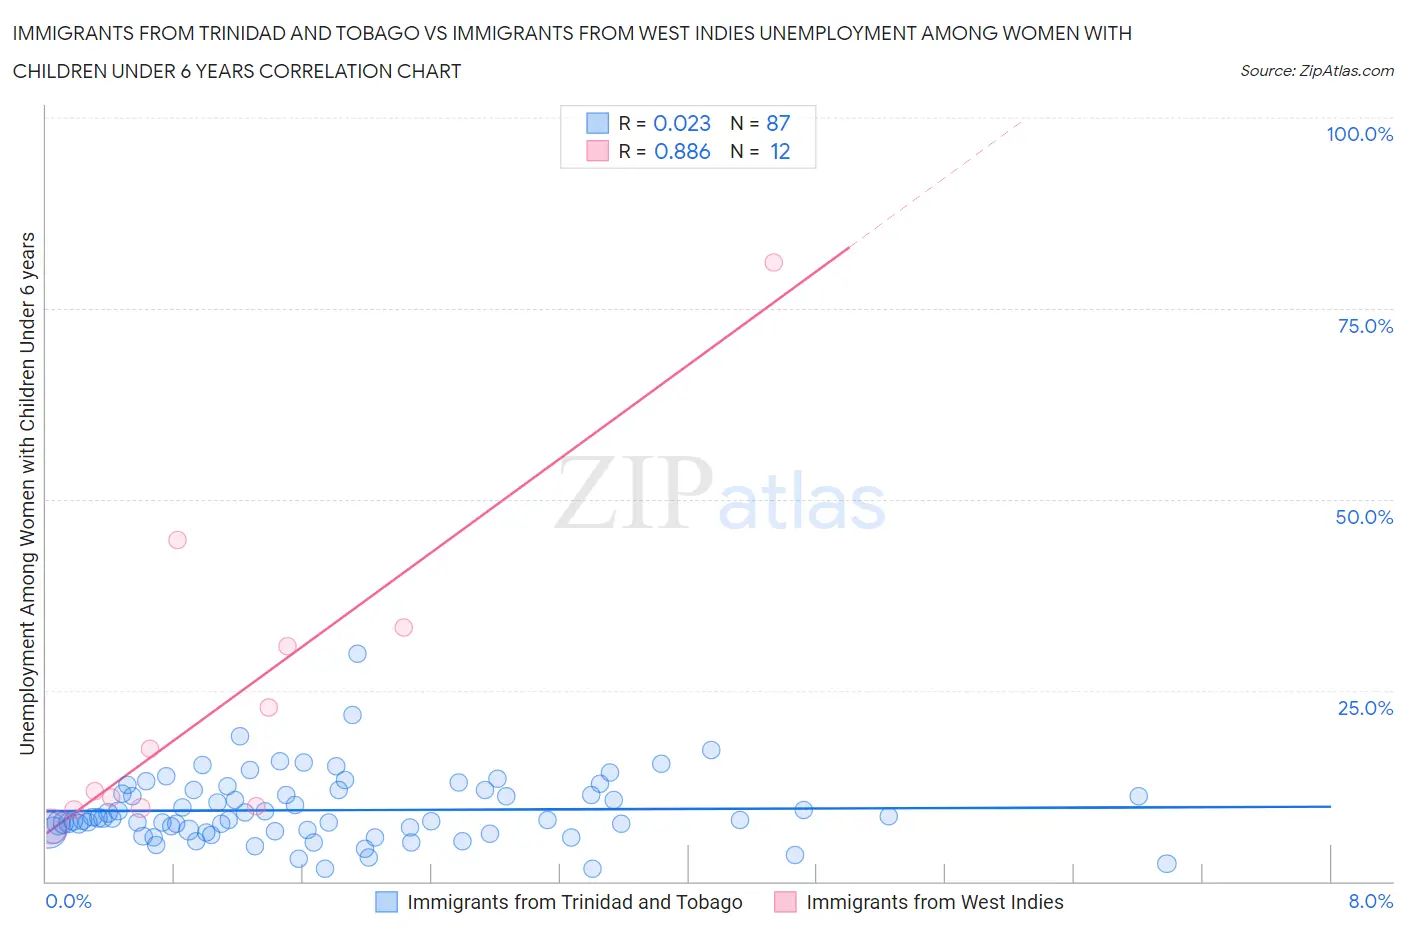
Immigrants from Trinidad and Tobago vs Immigrants from West Indies Unemployment Among Women with Children Under 6 years Correlation Chart
The statistical analysis conducted on geographies consisting of 187,913,923 people shows no correlation between the proportion of Immigrants from Trinidad and Tobago and unemployment rate among women with children under the age of 6 in the United States with a correlation coefficient (R) of 0.023 and weighted average of 8.0%. Similarly, the statistical analysis conducted on geographies consisting of 68,002,118 people shows a very strong positive correlation between the proportion of Immigrants from West Indies and unemployment rate among women with children under the age of 6 in the United States with a correlation coefficient (R) of 0.886 and weighted average of 9.0%, a difference of 12.7%.
Unemployment Among Women with Children Under 6 years Correlation Summary
| Measurement | Immigrants from Trinidad and Tobago | Immigrants from West Indies |
| Minimum | 1.6% | 7.2% |
| Maximum | 29.8% | 81.0% |
| Range | 28.2% | 73.8% |
| Mean | 9.3% | 24.0% |
| Median | 8.1% | 14.6% |
| Interquartile 25% (IQ1) | 6.7% | 9.7% |
| Interquartile 75% (IQ3) | 11.9% | 32.0% |
| Interquartile Range (IQR) | 5.2% | 22.3% |
| Standard Deviation (Sample) | 4.5% | 21.5% |
| Standard Deviation (Population) | 4.4% | 20.6% |
Similar Demographics by Unemployment Among Women with Children Under 6 years
Demographics Similar to Immigrants from Trinidad and Tobago by Unemployment Among Women with Children Under 6 years
In terms of unemployment among women with children under 6 years, the demographic groups most similar to Immigrants from Trinidad and Tobago are Welsh (8.0%, a difference of 0.090%), Kiowa (8.0%, a difference of 0.15%), Trinidadian and Tobagonian (8.0%, a difference of 0.17%), Finnish (8.0%, a difference of 0.18%), and Comanche (8.0%, a difference of 0.18%).
| Demographics | Rating | Rank | Unemployment Among Women with Children Under 6 years |
| Senegalese | 6.2 /100 | #226 | Tragic 8.0% |
| Portuguese | 6.2 /100 | #227 | Tragic 8.0% |
| Immigrants | Sudan | 6.0 /100 | #228 | Tragic 8.0% |
| Salvadorans | 5.5 /100 | #229 | Tragic 8.0% |
| Finns | 5.3 /100 | #230 | Tragic 8.0% |
| Trinidadians and Tobagonians | 5.3 /100 | #231 | Tragic 8.0% |
| Welsh | 5.0 /100 | #232 | Tragic 8.0% |
| Immigrants | Trinidad and Tobago | 4.8 /100 | #233 | Tragic 8.0% |
| Kiowa | 4.4 /100 | #234 | Tragic 8.0% |
| Comanche | 4.3 /100 | #235 | Tragic 8.0% |
| Immigrants | Barbados | 4.2 /100 | #236 | Tragic 8.0% |
| Immigrants | Costa Rica | 4.1 /100 | #237 | Tragic 8.0% |
| Immigrants | Middle Africa | 3.2 /100 | #238 | Tragic 8.1% |
| Irish | 2.7 /100 | #239 | Tragic 8.1% |
| Immigrants | El Salvador | 2.6 /100 | #240 | Tragic 8.1% |
Demographics Similar to Immigrants from West Indies by Unemployment Among Women with Children Under 6 years
In terms of unemployment among women with children under 6 years, the demographic groups most similar to Immigrants from West Indies are Hispanic or Latino (9.0%, a difference of 0.030%), Immigrants from Mexico (9.1%, a difference of 0.14%), Alaskan Athabascan (9.1%, a difference of 0.55%), Pueblo (9.1%, a difference of 0.73%), and Dominican (9.1%, a difference of 0.85%).
| Demographics | Rating | Rank | Unemployment Among Women with Children Under 6 years |
| Immigrants | Dominican Republic | 0.0 /100 | #296 | Tragic 8.9% |
| Mexicans | 0.0 /100 | #297 | Tragic 8.9% |
| Tlingit-Haida | 0.0 /100 | #298 | Tragic 8.9% |
| Immigrants | Jamaica | 0.0 /100 | #299 | Tragic 8.9% |
| Creek | 0.0 /100 | #300 | Tragic 8.9% |
| Chickasaw | 0.0 /100 | #301 | Tragic 9.0% |
| Hispanics or Latinos | 0.0 /100 | #302 | Tragic 9.0% |
| Immigrants | West Indies | 0.0 /100 | #303 | Tragic 9.0% |
| Immigrants | Mexico | 0.0 /100 | #304 | Tragic 9.1% |
| Alaskan Athabascans | 0.0 /100 | #305 | Tragic 9.1% |
| Pueblo | 0.0 /100 | #306 | Tragic 9.1% |
| Dominicans | 0.0 /100 | #307 | Tragic 9.1% |
| Immigrants | Micronesia | 0.0 /100 | #308 | Tragic 9.1% |
| Africans | 0.0 /100 | #309 | Tragic 9.2% |
| Cajuns | 0.0 /100 | #310 | Tragic 9.2% |