Immigrants from Thailand vs Immigrants from Ecuador Unemployment Among Youth under 25 years
COMPARE
Immigrants from Thailand
Immigrants from Ecuador
Unemployment Among Youth under 25 years
Unemployment Among Youth under 25 years Comparison
Immigrants from Thailand
Immigrants from Ecuador
11.3%
UNEMPLOYMENT AMONG YOUTH UNDER 25 YEARS
93.6/ 100
METRIC RATING
102nd/ 347
METRIC RANK
13.4%
UNEMPLOYMENT AMONG YOUTH UNDER 25 YEARS
0.0/ 100
METRIC RATING
290th/ 347
METRIC RANK
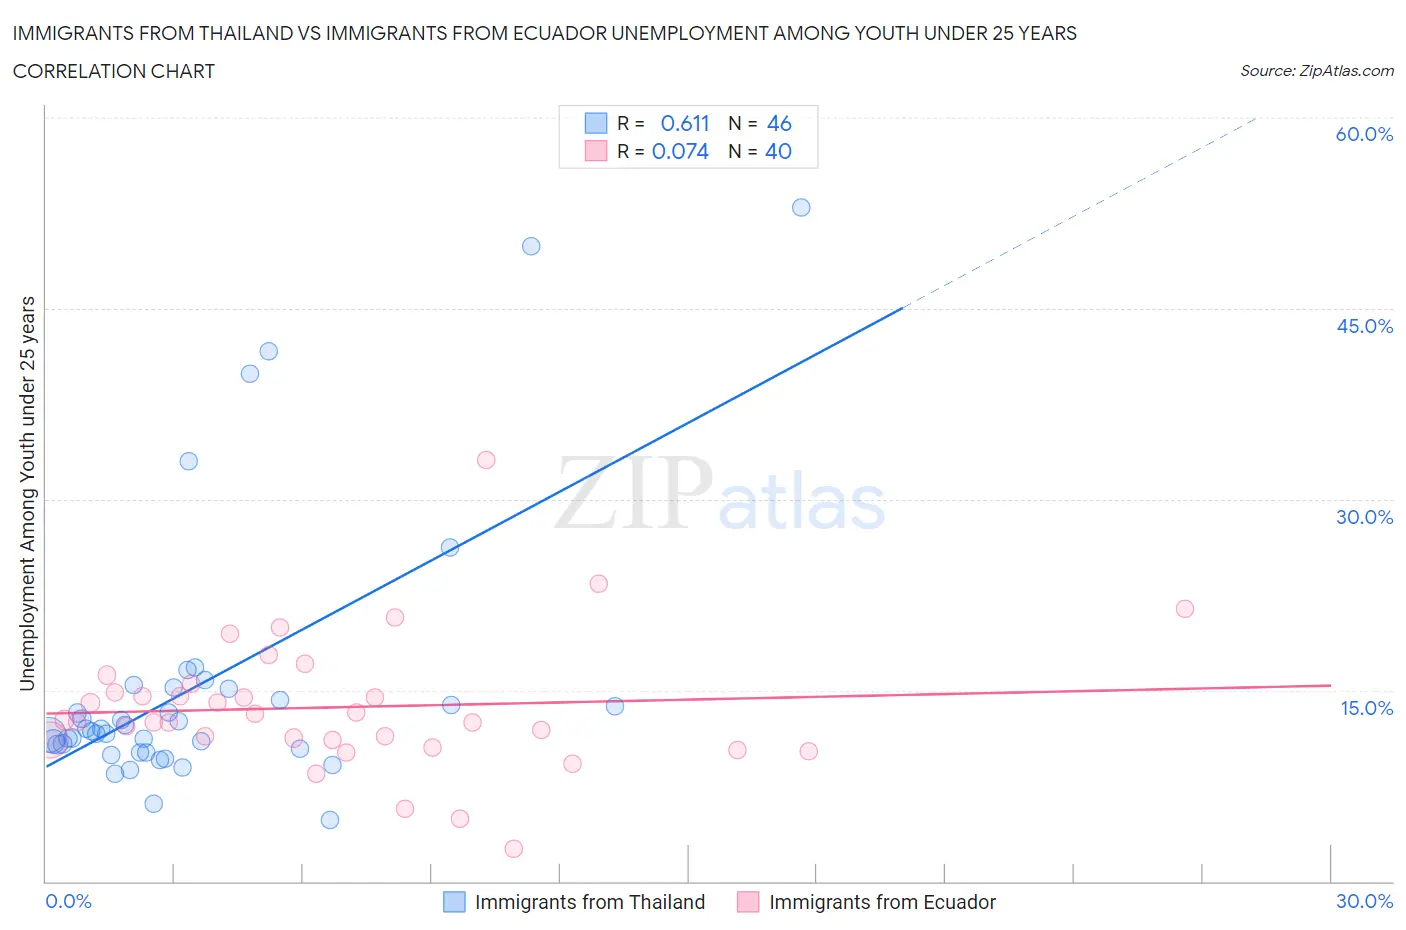
Immigrants from Thailand vs Immigrants from Ecuador Unemployment Among Youth under 25 years Correlation Chart
The statistical analysis conducted on geographies consisting of 314,872,704 people shows a significant positive correlation between the proportion of Immigrants from Thailand and unemployment rate among youth under the age of 25 in the United States with a correlation coefficient (R) of 0.611 and weighted average of 11.3%. Similarly, the statistical analysis conducted on geographies consisting of 269,322,147 people shows a slight positive correlation between the proportion of Immigrants from Ecuador and unemployment rate among youth under the age of 25 in the United States with a correlation coefficient (R) of 0.074 and weighted average of 13.4%, a difference of 19.0%.
Unemployment Among Youth under 25 years Correlation Summary
| Measurement | Immigrants from Thailand | Immigrants from Ecuador |
| Minimum | 4.8% | 2.6% |
| Maximum | 52.9% | 33.1% |
| Range | 48.1% | 30.5% |
| Mean | 15.4% | 13.7% |
| Median | 11.9% | 12.6% |
| Interquartile 25% (IQ1) | 10.4% | 11.1% |
| Interquartile 75% (IQ3) | 15.1% | 15.2% |
| Interquartile Range (IQR) | 4.7% | 4.0% |
| Standard Deviation (Sample) | 10.7% | 5.3% |
| Standard Deviation (Population) | 10.6% | 5.2% |
Similar Demographics by Unemployment Among Youth under 25 years
Demographics Similar to Immigrants from Thailand by Unemployment Among Youth under 25 years
In terms of unemployment among youth under 25 years, the demographic groups most similar to Immigrants from Thailand are Immigrants from Malaysia (11.3%, a difference of 0.0%), Immigrants from Afghanistan (11.3%, a difference of 0.020%), Iroquois (11.3%, a difference of 0.050%), Pakistani (11.3%, a difference of 0.070%), and Immigrants from Jordan (11.3%, a difference of 0.070%).
| Demographics | Rating | Rank | Unemployment Among Youth under 25 years |
| Carpatho Rusyns | 94.4 /100 | #95 | Exceptional 11.3% |
| Immigrants | Serbia | 94.4 /100 | #96 | Exceptional 11.3% |
| Nicaraguans | 94.3 /100 | #97 | Exceptional 11.3% |
| Estonians | 94.2 /100 | #98 | Exceptional 11.3% |
| Celtics | 94.0 /100 | #99 | Exceptional 11.3% |
| Pakistanis | 94.0 /100 | #100 | Exceptional 11.3% |
| Iroquois | 93.8 /100 | #101 | Exceptional 11.3% |
| Immigrants | Thailand | 93.6 /100 | #102 | Exceptional 11.3% |
| Immigrants | Malaysia | 93.6 /100 | #103 | Exceptional 11.3% |
| Immigrants | Afghanistan | 93.4 /100 | #104 | Exceptional 11.3% |
| Immigrants | Jordan | 93.1 /100 | #105 | Exceptional 11.3% |
| Chileans | 93.0 /100 | #106 | Exceptional 11.3% |
| Immigrants | Lithuania | 92.9 /100 | #107 | Exceptional 11.3% |
| Immigrants | Kuwait | 92.9 /100 | #108 | Exceptional 11.3% |
| Iranians | 92.0 /100 | #109 | Exceptional 11.3% |
Demographics Similar to Immigrants from Ecuador by Unemployment Among Youth under 25 years
In terms of unemployment among youth under 25 years, the demographic groups most similar to Immigrants from Ecuador are Apache (13.5%, a difference of 0.25%), Central American Indian (13.5%, a difference of 0.28%), Immigrants from Ghana (13.4%, a difference of 0.34%), Spanish American Indian (13.5%, a difference of 0.40%), and Immigrants from Western Africa (13.4%, a difference of 0.46%).
| Demographics | Rating | Rank | Unemployment Among Youth under 25 years |
| Immigrants | Cameroon | 0.0 /100 | #283 | Tragic 13.3% |
| Lumbee | 0.0 /100 | #284 | Tragic 13.3% |
| Ghanaians | 0.0 /100 | #285 | Tragic 13.3% |
| Blackfeet | 0.0 /100 | #286 | Tragic 13.3% |
| Ecuadorians | 0.0 /100 | #287 | Tragic 13.3% |
| Immigrants | Western Africa | 0.0 /100 | #288 | Tragic 13.4% |
| Immigrants | Ghana | 0.0 /100 | #289 | Tragic 13.4% |
| Immigrants | Ecuador | 0.0 /100 | #290 | Tragic 13.4% |
| Apache | 0.0 /100 | #291 | Tragic 13.5% |
| Central American Indians | 0.0 /100 | #292 | Tragic 13.5% |
| Spanish American Indians | 0.0 /100 | #293 | Tragic 13.5% |
| Immigrants | Caribbean | 0.0 /100 | #294 | Tragic 13.5% |
| Chippewa | 0.0 /100 | #295 | Tragic 13.5% |
| Senegalese | 0.0 /100 | #296 | Tragic 13.5% |
| U.S. Virgin Islanders | 0.0 /100 | #297 | Tragic 13.6% |