Immigrants from Taiwan vs Mongolian Unemployment Among Ages 16 to 19 years
COMPARE
Immigrants from Taiwan
Mongolian
Unemployment Among Ages 16 to 19 years
Unemployment Among Ages 16 to 19 years Comparison
Immigrants from Taiwan
Mongolians
15.8%
UNEMPLOYMENT AMONG AGES 16 TO 19 YEARS
100.0/ 100
METRIC RATING
21st/ 347
METRIC RANK
16.9%
UNEMPLOYMENT AMONG AGES 16 TO 19 YEARS
95.6/ 100
METRIC RATING
95th/ 347
METRIC RANK
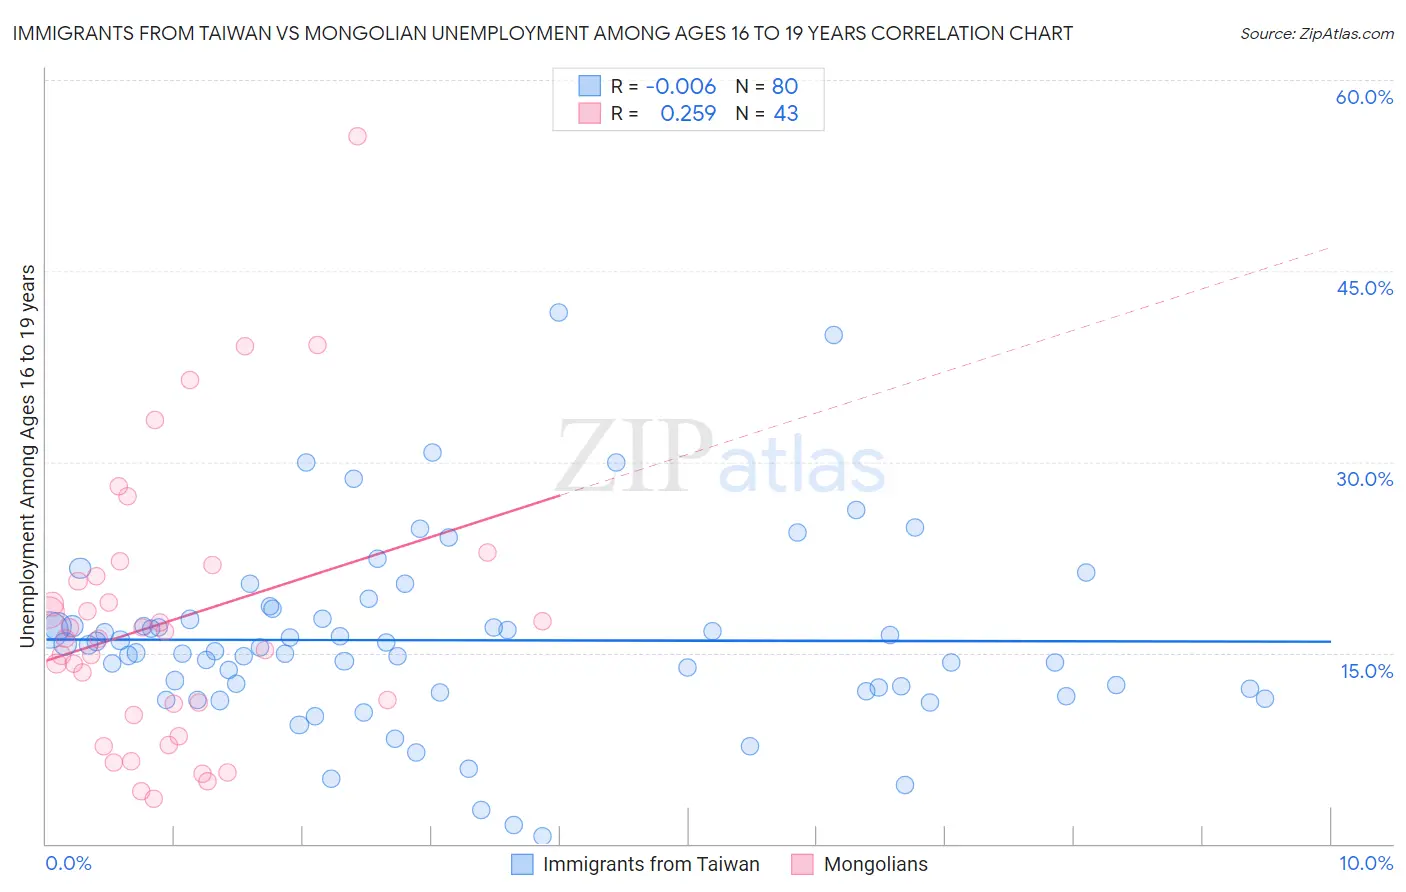
Immigrants from Taiwan vs Mongolian Unemployment Among Ages 16 to 19 years Correlation Chart
The statistical analysis conducted on geographies consisting of 286,729,019 people shows no correlation between the proportion of Immigrants from Taiwan and unemployment rate among population between the ages 16 and 19 in the United States with a correlation coefficient (R) of -0.006 and weighted average of 15.8%. Similarly, the statistical analysis conducted on geographies consisting of 137,919,207 people shows a weak positive correlation between the proportion of Mongolians and unemployment rate among population between the ages 16 and 19 in the United States with a correlation coefficient (R) of 0.259 and weighted average of 16.9%, a difference of 7.0%.
Unemployment Among Ages 16 to 19 years Correlation Summary
| Measurement | Immigrants from Taiwan | Mongolian |
| Minimum | 0.60% | 3.5% |
| Maximum | 41.8% | 55.6% |
| Range | 41.2% | 52.1% |
| Mean | 16.0% | 17.4% |
| Median | 15.3% | 16.1% |
| Interquartile 25% (IQ1) | 12.1% | 10.1% |
| Interquartile 75% (IQ3) | 17.6% | 21.0% |
| Interquartile Range (IQR) | 5.5% | 10.9% |
| Standard Deviation (Sample) | 7.2% | 10.8% |
| Standard Deviation (Population) | 7.2% | 10.7% |
Similar Demographics by Unemployment Among Ages 16 to 19 years
Demographics Similar to Immigrants from Taiwan by Unemployment Among Ages 16 to 19 years
In terms of unemployment among ages 16 to 19 years, the demographic groups most similar to Immigrants from Taiwan are Sudanese (15.8%, a difference of 0.33%), Finnish (15.9%, a difference of 0.36%), Belgian (15.9%, a difference of 0.40%), Swiss (15.8%, a difference of 0.42%), and Thai (15.7%, a difference of 0.54%).
| Demographics | Rating | Rank | Unemployment Among Ages 16 to 19 years |
| Immigrants | Zaire | 100.0 /100 | #14 | Exceptional 15.6% |
| Yugoslavians | 100.0 /100 | #15 | Exceptional 15.6% |
| Germans | 100.0 /100 | #16 | Exceptional 15.7% |
| Somalis | 100.0 /100 | #17 | Exceptional 15.7% |
| Thais | 100.0 /100 | #18 | Exceptional 15.7% |
| Swiss | 100.0 /100 | #19 | Exceptional 15.8% |
| Sudanese | 100.0 /100 | #20 | Exceptional 15.8% |
| Immigrants | Taiwan | 100.0 /100 | #21 | Exceptional 15.8% |
| Finns | 100.0 /100 | #22 | Exceptional 15.9% |
| Belgians | 100.0 /100 | #23 | Exceptional 15.9% |
| Tongans | 100.0 /100 | #24 | Exceptional 15.9% |
| Filipinos | 100.0 /100 | #25 | Exceptional 15.9% |
| Dutch | 100.0 /100 | #26 | Exceptional 15.9% |
| Immigrants | Sudan | 99.9 /100 | #27 | Exceptional 16.0% |
| Jordanians | 99.9 /100 | #28 | Exceptional 16.0% |
Demographics Similar to Mongolians by Unemployment Among Ages 16 to 19 years
In terms of unemployment among ages 16 to 19 years, the demographic groups most similar to Mongolians are Ottawa (16.9%, a difference of 0.040%), Immigrants from Venezuela (16.9%, a difference of 0.060%), Bangladeshi (16.9%, a difference of 0.070%), Cuban (16.9%, a difference of 0.080%), and South African (16.9%, a difference of 0.12%).
| Demographics | Rating | Rank | Unemployment Among Ages 16 to 19 years |
| Immigrants | South Africa | 96.9 /100 | #88 | Exceptional 16.9% |
| Canadians | 96.7 /100 | #89 | Exceptional 16.9% |
| Asians | 96.6 /100 | #90 | Exceptional 16.9% |
| Cambodians | 96.3 /100 | #91 | Exceptional 16.9% |
| South Africans | 95.9 /100 | #92 | Exceptional 16.9% |
| Cubans | 95.8 /100 | #93 | Exceptional 16.9% |
| Bangladeshis | 95.8 /100 | #94 | Exceptional 16.9% |
| Mongolians | 95.6 /100 | #95 | Exceptional 16.9% |
| Ottawa | 95.4 /100 | #96 | Exceptional 16.9% |
| Immigrants | Venezuela | 95.3 /100 | #97 | Exceptional 16.9% |
| Burmese | 95.0 /100 | #98 | Exceptional 17.0% |
| Immigrants | Lithuania | 94.9 /100 | #99 | Exceptional 17.0% |
| Immigrants | Thailand | 94.7 /100 | #100 | Exceptional 17.0% |
| Immigrants | Saudi Arabia | 94.7 /100 | #101 | Exceptional 17.0% |
| Immigrants | Pakistan | 94.6 /100 | #102 | Exceptional 17.0% |