Immigrants from Taiwan vs Luxembourger Unemployment Among Ages 25 to 29 years
COMPARE
Immigrants from Taiwan
Luxembourger
Unemployment Among Ages 25 to 29 years
Unemployment Among Ages 25 to 29 years Comparison
Immigrants from Taiwan
Luxembourgers
6.2%
UNEMPLOYMENT AMONG AGES 25 TO 29 YEARS
98.3/ 100
METRIC RATING
60th/ 347
METRIC RANK
6.2%
UNEMPLOYMENT AMONG AGES 25 TO 29 YEARS
98.3/ 100
METRIC RATING
59th/ 347
METRIC RANK
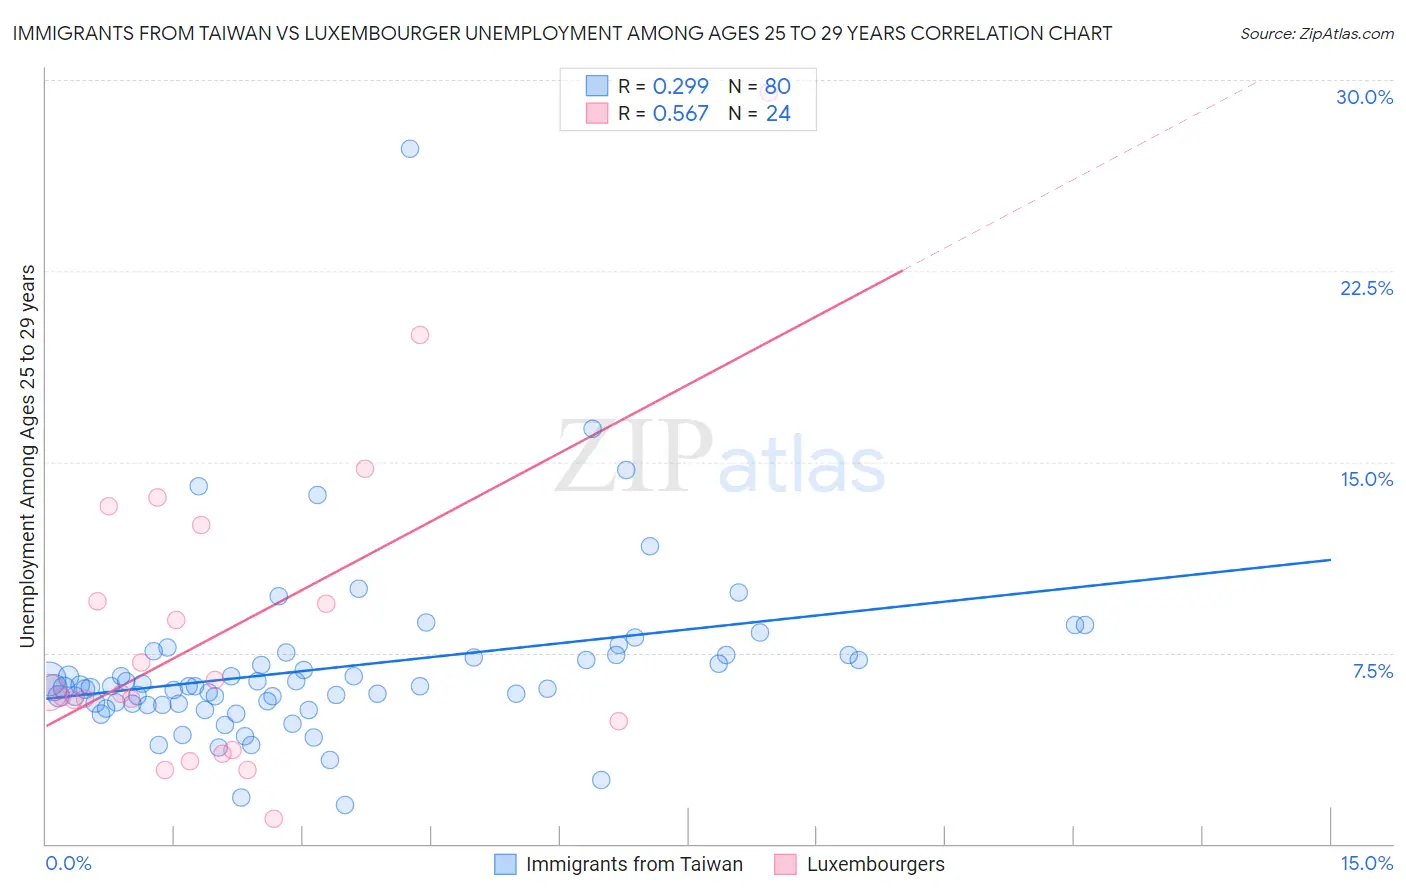
Immigrants from Taiwan vs Luxembourger Unemployment Among Ages 25 to 29 years Correlation Chart
The statistical analysis conducted on geographies consisting of 288,232,116 people shows a weak positive correlation between the proportion of Immigrants from Taiwan and unemployment rate among population between the ages 25 and 29 in the United States with a correlation coefficient (R) of 0.299 and weighted average of 6.2%. Similarly, the statistical analysis conducted on geographies consisting of 139,041,741 people shows a substantial positive correlation between the proportion of Luxembourgers and unemployment rate among population between the ages 25 and 29 in the United States with a correlation coefficient (R) of 0.567 and weighted average of 6.2%, a difference of 0.020%.
Unemployment Among Ages 25 to 29 years Correlation Summary
| Measurement | Immigrants from Taiwan | Luxembourger |
| Minimum | 1.5% | 1.0% |
| Maximum | 27.3% | 29.5% |
| Range | 25.8% | 28.5% |
| Mean | 6.9% | 8.4% |
| Median | 6.2% | 5.9% |
| Interquartile 25% (IQ1) | 5.5% | 4.3% |
| Interquartile 75% (IQ3) | 7.4% | 11.0% |
| Interquartile Range (IQR) | 1.9% | 6.8% |
| Standard Deviation (Sample) | 3.4% | 6.4% |
| Standard Deviation (Population) | 3.4% | 6.2% |
Demographics Similar to Immigrants from Taiwan and Luxembourgers by Unemployment Among Ages 25 to 29 years
In terms of unemployment among ages 25 to 29 years, the demographic groups most similar to Immigrants from Taiwan are Bhutanese (6.2%, a difference of 0.12%), Immigrants from Eastern Asia (6.2%, a difference of 0.15%), Immigrants from China (6.2%, a difference of 0.22%), Kenyan (6.3%, a difference of 0.29%), and Immigrants from Saudi Arabia (6.2%, a difference of 0.32%). Similarly, the demographic groups most similar to Luxembourgers are Immigrants from Eastern Asia (6.2%, a difference of 0.13%), Bhutanese (6.2%, a difference of 0.15%), Immigrants from China (6.2%, a difference of 0.24%), Immigrants from Saudi Arabia (6.2%, a difference of 0.29%), and Kenyan (6.3%, a difference of 0.32%).
| Demographics | Rating | Rank | Unemployment Among Ages 25 to 29 years |
| German Russians | 99.0 /100 | #49 | Exceptional 6.2% |
| Soviet Union | 98.9 /100 | #50 | Exceptional 6.2% |
| Burmese | 98.9 /100 | #51 | Exceptional 6.2% |
| Immigrants | Turkey | 98.9 /100 | #52 | Exceptional 6.2% |
| Turks | 98.8 /100 | #53 | Exceptional 6.2% |
| Swedes | 98.8 /100 | #54 | Exceptional 6.2% |
| Immigrants | Netherlands | 98.7 /100 | #55 | Exceptional 6.2% |
| Immigrants | Burma/Myanmar | 98.7 /100 | #56 | Exceptional 6.2% |
| Immigrants | Saudi Arabia | 98.6 /100 | #57 | Exceptional 6.2% |
| Immigrants | Eastern Asia | 98.4 /100 | #58 | Exceptional 6.2% |
| Luxembourgers | 98.3 /100 | #59 | Exceptional 6.2% |
| Immigrants | Taiwan | 98.3 /100 | #60 | Exceptional 6.2% |
| Bhutanese | 98.2 /100 | #61 | Exceptional 6.2% |
| Immigrants | China | 98.1 /100 | #62 | Exceptional 6.2% |
| Kenyans | 98.0 /100 | #63 | Exceptional 6.3% |
| Immigrants | Sri Lanka | 97.9 /100 | #64 | Exceptional 6.3% |
| Immigrants | Lebanon | 97.8 /100 | #65 | Exceptional 6.3% |
| Indians (Asian) | 97.8 /100 | #66 | Exceptional 6.3% |
| Immigrants | Northern Africa | 97.8 /100 | #67 | Exceptional 6.3% |
| Palestinians | 97.7 /100 | #68 | Exceptional 6.3% |
| Immigrants | Hong Kong | 97.5 /100 | #69 | Exceptional 6.3% |