Immigrants from Syria vs Peruvian Unemployment Among Ages 30 to 34 years
COMPARE
Immigrants from Syria
Peruvian
Unemployment Among Ages 30 to 34 years
Unemployment Among Ages 30 to 34 years Comparison
Immigrants from Syria
Peruvians
5.7%
UNEMPLOYMENT AMONG AGES 30 TO 34 YEARS
5.5/ 100
METRIC RATING
216th/ 347
METRIC RANK
5.5%
UNEMPLOYMENT AMONG AGES 30 TO 34 YEARS
50.2/ 100
METRIC RATING
173rd/ 347
METRIC RANK
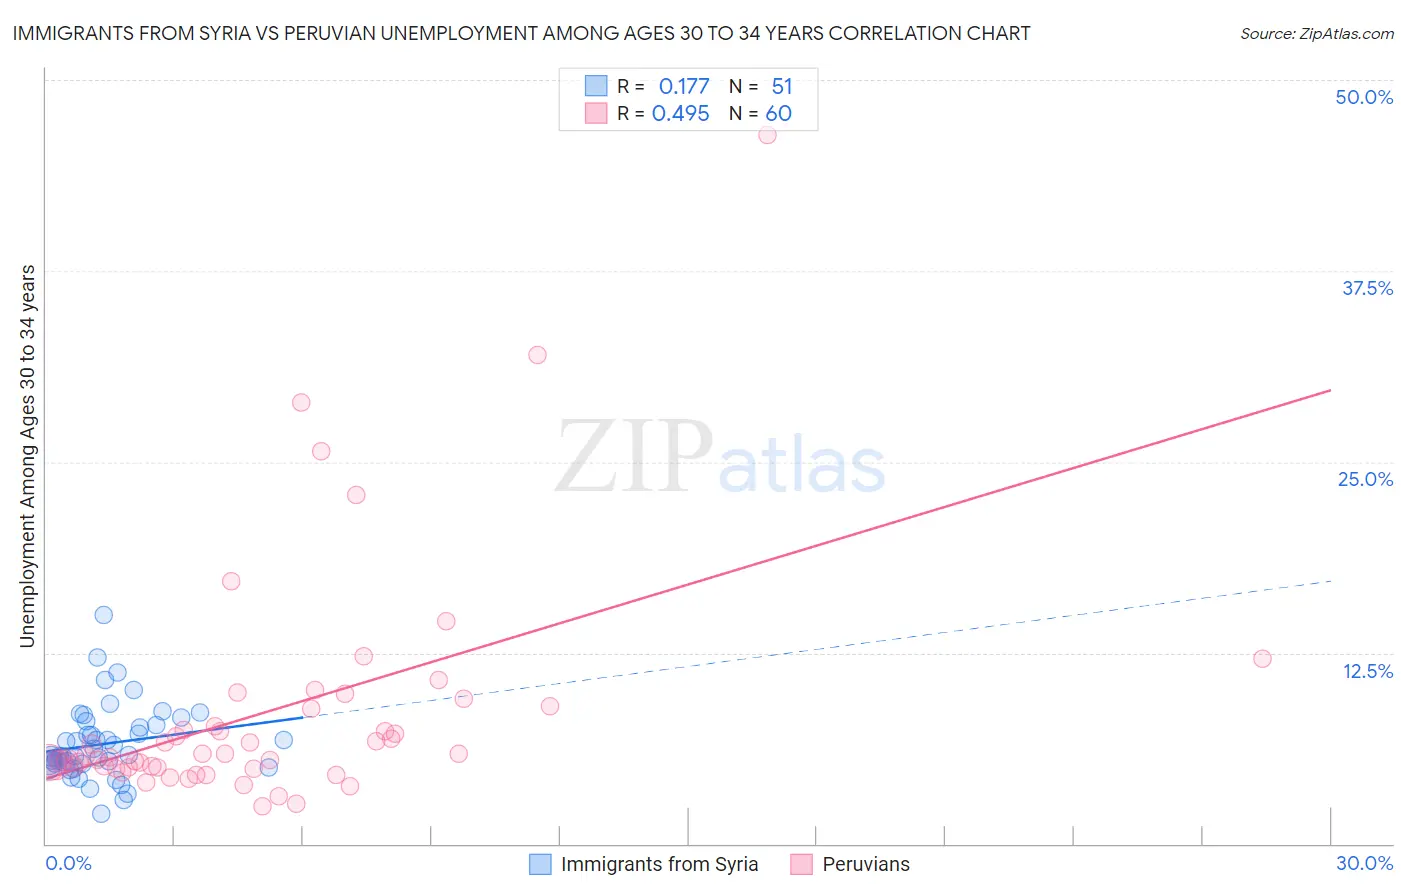
Immigrants from Syria vs Peruvian Unemployment Among Ages 30 to 34 years Correlation Chart
The statistical analysis conducted on geographies consisting of 170,536,276 people shows a poor positive correlation between the proportion of Immigrants from Syria and unemployment rate among population between the ages 30 and 34 in the United States with a correlation coefficient (R) of 0.177 and weighted average of 5.7%. Similarly, the statistical analysis conducted on geographies consisting of 346,915,622 people shows a moderate positive correlation between the proportion of Peruvians and unemployment rate among population between the ages 30 and 34 in the United States with a correlation coefficient (R) of 0.495 and weighted average of 5.5%, a difference of 5.0%.
Unemployment Among Ages 30 to 34 years Correlation Summary
| Measurement | Immigrants from Syria | Peruvian |
| Minimum | 2.0% | 2.5% |
| Maximum | 15.0% | 46.4% |
| Range | 13.0% | 43.9% |
| Mean | 6.5% | 8.6% |
| Median | 5.7% | 5.8% |
| Interquartile 25% (IQ1) | 5.2% | 5.0% |
| Interquartile 75% (IQ3) | 7.8% | 8.9% |
| Interquartile Range (IQR) | 2.6% | 4.0% |
| Standard Deviation (Sample) | 2.4% | 7.8% |
| Standard Deviation (Population) | 2.4% | 7.7% |
Similar Demographics by Unemployment Among Ages 30 to 34 years
Demographics Similar to Immigrants from Syria by Unemployment Among Ages 30 to 34 years
In terms of unemployment among ages 30 to 34 years, the demographic groups most similar to Immigrants from Syria are Immigrants from Cambodia (5.7%, a difference of 0.11%), Immigrants from Panama (5.7%, a difference of 0.12%), Immigrants from Fiji (5.7%, a difference of 0.14%), Panamanian (5.8%, a difference of 0.35%), and French Canadian (5.8%, a difference of 0.38%).
| Demographics | Rating | Rank | Unemployment Among Ages 30 to 34 years |
| French | 10.8 /100 | #209 | Poor 5.7% |
| Whites/Caucasians | 9.2 /100 | #210 | Tragic 5.7% |
| Spanish American Indians | 8.7 /100 | #211 | Tragic 5.7% |
| Scotch-Irish | 8.6 /100 | #212 | Tragic 5.7% |
| Immigrants | Immigrants | 7.1 /100 | #213 | Tragic 5.7% |
| Immigrants | Panama | 5.9 /100 | #214 | Tragic 5.7% |
| Immigrants | Cambodia | 5.8 /100 | #215 | Tragic 5.7% |
| Immigrants | Syria | 5.5 /100 | #216 | Tragic 5.7% |
| Immigrants | Fiji | 5.1 /100 | #217 | Tragic 5.7% |
| Panamanians | 4.5 /100 | #218 | Tragic 5.8% |
| French Canadians | 4.4 /100 | #219 | Tragic 5.8% |
| Sierra Leoneans | 3.9 /100 | #220 | Tragic 5.8% |
| Guamanians/Chamorros | 3.9 /100 | #221 | Tragic 5.8% |
| Spaniards | 3.2 /100 | #222 | Tragic 5.8% |
| Bermudans | 2.7 /100 | #223 | Tragic 5.8% |
Demographics Similar to Peruvians by Unemployment Among Ages 30 to 34 years
In terms of unemployment among ages 30 to 34 years, the demographic groups most similar to Peruvians are Immigrants from Laos (5.5%, a difference of 0.010%), Afghan (5.5%, a difference of 0.040%), Immigrants from Austria (5.5%, a difference of 0.080%), Scottish (5.5%, a difference of 0.11%), and Immigrants from Peru (5.5%, a difference of 0.15%).
| Demographics | Rating | Rank | Unemployment Among Ages 30 to 34 years |
| Immigrants | Thailand | 55.6 /100 | #166 | Average 5.4% |
| English | 54.8 /100 | #167 | Average 5.4% |
| South Americans | 52.9 /100 | #168 | Average 5.4% |
| Immigrants | Israel | 52.9 /100 | #169 | Average 5.4% |
| Dutch | 52.6 /100 | #170 | Average 5.5% |
| Scottish | 51.8 /100 | #171 | Average 5.5% |
| Immigrants | Austria | 51.3 /100 | #172 | Average 5.5% |
| Peruvians | 50.2 /100 | #173 | Average 5.5% |
| Immigrants | Laos | 50.0 /100 | #174 | Average 5.5% |
| Afghans | 49.6 /100 | #175 | Average 5.5% |
| Immigrants | Peru | 48.0 /100 | #176 | Average 5.5% |
| Immigrants | Ukraine | 47.7 /100 | #177 | Average 5.5% |
| Macedonians | 47.1 /100 | #178 | Average 5.5% |
| Costa Ricans | 46.7 /100 | #179 | Average 5.5% |
| Italians | 45.5 /100 | #180 | Average 5.5% |