Immigrants from Syria vs Afghan Unemployment Among Ages 55 to 59 years

COMPARE

Immigrants from Syria
Race
Ancestry
AfricanAlaska NativeAlaskan AthabascanAlbanianAleutAlsatianAmericanApacheArabArapahoArgentineanArmenianAssyrian/Chaldean/SyriacAustralianAustrianBahamianBangladeshiBarbadianBasqueBelgianBelizeanBermudanBhutaneseBlackfeetBolivianBrazilianBritishBritish West IndianBulgarianBurmeseCajunCambodianCanadianCape VerdeanCarpatho RusynCelticCentral AmericanCentral American IndianCherokeeCheyenneChickasawChileanChineseChippewaChoctawColombianColvilleComancheCosta RicanCreeCreekCroatianCrowCubanCypriotCzechCzechoslovakianDanishDelawareDominicanDutchDutch West IndianEastern EuropeanEcuadorianEgyptianEnglishEstonianEthiopianEuropeanFijianFilipinoFinnishFrenchFrench American IndianFrench CanadianGermanGerman RussianGhanaianGreekGuamanian/ChamorroGuatemalanGuyaneseHaitianHmongHonduranHopiHoumaHungarianIcelanderIndian (Asian)IndonesianInupiatIranianIraqiIrishIroquoisIsraeliItalianJamaicanJapaneseJordanianKenyanKiowaKoreanLaotianLatvianLebaneseLiberianLithuanianLumbeeLuxembourgerMacedonianMalaysianMalteseMarshalleseMenomineeMexicanMexican American IndianMongolianMoroccanNative HawaiianNavajoNepaleseNew ZealanderNicaraguanNigerianNorthern EuropeanNorwegianOkinawanOsageOttawaPaiutePakistaniPalestinianPanamanianParaguayanPennsylvania GermanPeruvianPimaPolishPortuguesePotawatomiPuebloPuerto RicanPuget Sound SalishRomanianRussianSalvadoranSamoanScandinavianScotch-IrishScottishSeminoleSenegaleseSerbianShoshoneSierra LeoneanSiouxSlavicSlovakSloveneSomaliSouth AfricanSouth AmericanSouth American IndianSoviet UnionSpaniardSpanishSpanish AmericanSpanish American IndianSri LankanSubsaharan AfricanSudaneseSwedishSwissSyrianTaiwaneseThaiTlingit-HaidaTohono O'OdhamTonganTrinidadian and TobagonianTsimshianTurkishU.S. Virgin IslanderUgandanUkrainianUruguayanUteVenezuelanVietnameseWelshWest IndianYakamaYaquiYugoslavianYumanYup'ikZimbabwean
Immigration
NonimmigrantsImmigrantsAfghanistanAfricaAlbaniaArgentinaArmeniaAsiaAustraliaAustriaBahamasBangladeshBarbadosBelarusBelgiumBelizeBoliviaBosnia and HerzegovinaBrazilBulgariaBurma/MyanmarCabo VerdeCambodiaCameroonCanadaCaribbeanCentral AmericaChileChinaColombiaCongoCosta RicaCroatiaCubaCzechoslovakiaDenmarkDominicaDominican RepublicEastern AfricaEastern AsiaEastern EuropeEcuadorEgyptEl SalvadorEnglandEritreaEthiopiaEuropeFijiFranceGermanyGhanaGreeceGrenadaGuatemalaGuyanaHaitiHondurasHong KongHungaryIndiaIndonesiaIranIraqIrelandIsraelItalyJamaicaJapanJordanKazakhstanKenyaKoreaKuwaitLaosLatin AmericaLatviaLebanonLiberiaLithuaniaMalaysiaMexicoMicronesiaMiddle AfricaMoldovaMoroccoNepalNetherlandsNicaraguaNigeriaNorth AmericaNorth MacedoniaNorthern AfricaNorthern EuropeNorwayOceaniaPakistanPanamaPeruPhilippinesPolandPortugalRomaniaRussiaSaudi ArabiaScotlandSenegalSerbiaSierra LeoneSingaporeSomaliaSouth AfricaSouth AmericaSouth Central AsiaSouth Eastern AsiaSouthern EuropeSpainSri LankaSt. Vincent and the GrenadinesSudanSwedenSwitzerlandSyriaTaiwanThailandTrinidad and TobagoTurkeyUgandaUkraineUruguayUzbekistanVenezuelaVietnamWest IndiesWestern AfricaWestern AsiaWestern EuropeYemenZaireZimbabweAzores
Afghan
Race
Ancestry
AfghanAfricanAlaska NativeAlaskan AthabascanAlbanianAleutAlsatianAmericanApacheArabArapahoArgentineanArmenianAssyrian/Chaldean/SyriacAustralianAustrianBahamianBangladeshiBarbadianBasqueBelgianBelizeanBermudanBhutaneseBlackfeetBolivianBrazilianBritishBritish West IndianBulgarianBurmeseCajunCambodianCanadianCape VerdeanCarpatho RusynCelticCentral AmericanCentral American IndianCherokeeCheyenneChickasawChileanChineseChippewaChoctawColombianColvilleComancheCosta RicanCreeCreekCroatianCrowCubanCypriotCzechCzechoslovakianDanishDelawareDominicanDutchDutch West IndianEastern EuropeanEcuadorianEgyptianEnglishEstonianEthiopianEuropeanFijianFilipinoFinnishFrenchFrench American IndianFrench CanadianGermanGerman RussianGhanaianGreekGuamanian/ChamorroGuatemalanGuyaneseHaitianHmongHonduranHopiHoumaHungarianIcelanderIndian (Asian)IndonesianInupiatIranianIraqiIrishIroquoisIsraeliItalianJamaicanJapaneseJordanianKenyanKiowaKoreanLaotianLatvianLebaneseLiberianLithuanianLumbeeLuxembourgerMacedonianMalaysianMalteseMarshalleseMenomineeMexicanMexican American IndianMongolianMoroccanNative HawaiianNavajoNepaleseNew ZealanderNicaraguanNigerianNorthern EuropeanNorwegianOkinawanOsageOttawaPaiutePakistaniPalestinianPanamanianParaguayanPennsylvania GermanPeruvianPimaPolishPortuguesePotawatomiPuebloPuerto RicanPuget Sound SalishRomanianRussianSalvadoranSamoanScandinavianScotch-IrishScottishSeminoleSenegaleseSerbianShoshoneSierra LeoneanSiouxSlavicSlovakSloveneSomaliSouth AfricanSouth AmericanSouth American IndianSoviet UnionSpaniardSpanishSpanish AmericanSpanish American IndianSri LankanSubsaharan AfricanSudaneseSwedishSwissSyrianTaiwaneseThaiTlingit-HaidaTohono O'OdhamTonganTrinidadian and TobagonianTsimshianTurkishU.S. Virgin IslanderUgandanUkrainianUruguayanUteVenezuelanVietnameseWelshWest IndianYakamaYaquiYugoslavianYumanYup'ikZimbabwean
Immigration
NonimmigrantsImmigrantsAfghanistanAfricaAlbaniaArgentinaArmeniaAsiaAustraliaAustriaBahamasBangladeshBarbadosBelarusBelgiumBelizeBoliviaBosnia and HerzegovinaBrazilBulgariaBurma/MyanmarCabo VerdeCambodiaCameroonCanadaCaribbeanCentral AmericaChileChinaColombiaCongoCosta RicaCroatiaCubaCzechoslovakiaDenmarkDominicaDominican RepublicEastern AfricaEastern AsiaEastern EuropeEcuadorEgyptEl SalvadorEnglandEritreaEthiopiaEuropeFijiFranceGermanyGhanaGreeceGrenadaGuatemalaGuyanaHaitiHondurasHong KongHungaryIndiaIndonesiaIranIraqIrelandIsraelItalyJamaicaJapanJordanKazakhstanKenyaKoreaKuwaitLaosLatin AmericaLatviaLebanonLiberiaLithuaniaMalaysiaMexicoMicronesiaMiddle AfricaMoldovaMoroccoNepalNetherlandsNicaraguaNigeriaNorth AmericaNorth MacedoniaNorthern AfricaNorthern EuropeNorwayOceaniaPakistanPanamaPeruPhilippinesPolandPortugalRomaniaRussiaSaudi ArabiaScotlandSenegalSerbiaSierra LeoneSingaporeSomaliaSouth AfricaSouth AmericaSouth Central AsiaSouth Eastern AsiaSouthern EuropeSpainSri LankaSt. Vincent and the GrenadinesSudanSwedenSwitzerlandTaiwanThailandTrinidad and TobagoTurkeyUgandaUkraineUruguayUzbekistanVenezuelaVietnamWest IndiesWestern AfricaWestern AsiaWestern EuropeYemenZaireZimbabweAzores
Unemployment Among Ages 55 to 59 years
Income
Poverty
Unemployment
Labor Participation
Family Structure
Vehicle Availability
Education Level
Disability

Unemployment Among Ages 55 to 59 years Comparison

Immigrants from Syria

Afghans

Tragic
Exceptional
5.0%
UNEMPLOYMENT AMONG AGES 55 TO 59 YEARS
2.7/ 100
METRIC RATING
230th/ 347
METRIC RANK
4.7%
UNEMPLOYMENT AMONG AGES 55 TO 59 YEARS
92.1/ 100
METRIC RATING
112th/ 347
METRIC RANK

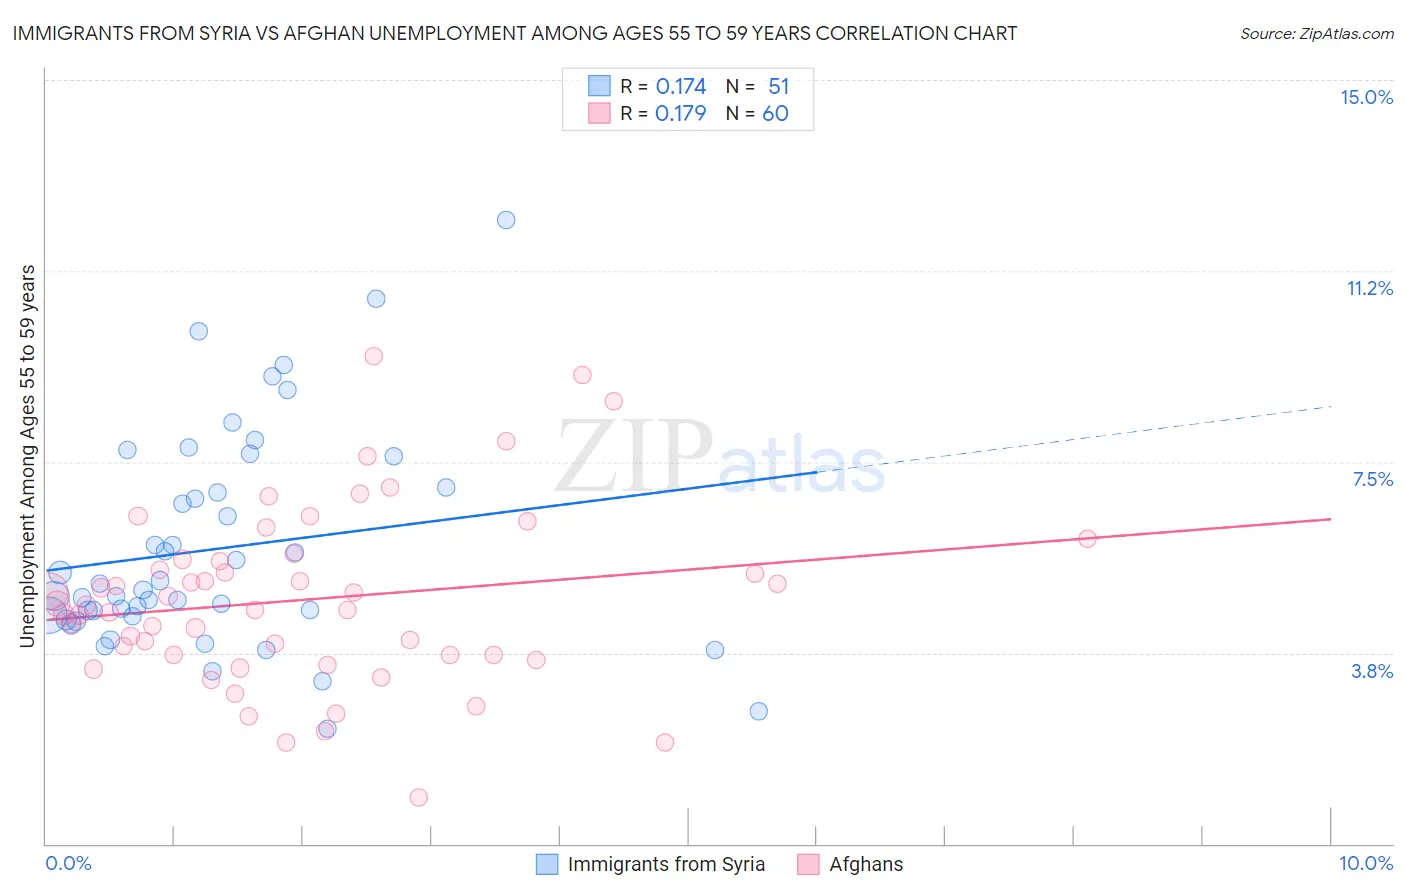
Immigrants from Syria vs Afghan Unemployment Among Ages 55 to 59 years Correlation Chart

The statistical analysis conducted on geographies consisting of 169,983,921 people shows a poor positive correlation between the proportion of Immigrants from Syria and unemployment rate among population between the ages 55 and 59 in the United States with a correlation coefficient (R) of 0.174 and weighted average of 5.0%. Similarly, the statistical analysis conducted on geographies consisting of 145,461,524 people shows a poor positive correlation between the proportion of Afghans and unemployment rate among population between the ages 55 and 59 in the United States with a correlation coefficient (R) of 0.179 and weighted average of 4.7%, a difference of 6.3%.
Immigrants from Syria vs Afghan Unemployment Among Ages 55 to 59 years

Unemployment Among Ages 55 to 59 years Correlation Summary

MeasurementImmigrants from SyriaAfghan
Minimum2.3%0.90%
Maximum12.2%9.6%
Range10.0%8.7%
Mean5.8%4.8%
Median5.0%4.6%
Interquartile 25% (IQ1)4.5%3.7%
Interquartile 75% (IQ3)7.0%5.6%
Interquartile Range (IQR)2.5%1.9%
Standard Deviation (Sample)2.1%1.7%
Standard Deviation (Population)2.1%1.7%

Similar Demographics by Unemployment Among Ages 55 to 59 years

Demographics Similar to Immigrants from Syria by Unemployment Among Ages 55 to 59 years

In terms of unemployment among ages 55 to 59 years, the demographic groups most similar to Immigrants from Syria are Cherokee (5.0%, a difference of 0.030%), Albanian (5.0%, a difference of 0.080%), Immigrants from Western Asia (5.0%, a difference of 0.10%), Immigrants (5.0%, a difference of 0.17%), and Immigrants from Liberia (5.0%, a difference of 0.18%).
DemographicsRating | RankUnemployment Among Ages 55 to 59 years
Immigrants | Ireland
4.8
/100
|
#223
Tragic
5.0%
Sub-Saharan Africans
4.4
/100
|
#224
Tragic
5.0%
Costa Ricans
4.4
/100
|
#225
Tragic
5.0%
Immigrants | China
4.2
/100
|
#226
Tragic
5.0%
Immigrants | Iran
3.7
/100
|
#227
Tragic
5.0%
Immigrants | Liberia
3.2
/100
|
#228
Tragic
5.0%
Immigrants | Western Asia
3.0
/100
|
#229
Tragic
5.0%
Immigrants | Syria
2.7
/100
|
#230
Tragic
5.0%
Cherokee
2.6
/100
|
#231
Tragic
5.0%
Albanians
2.5
/100
|
#232
Tragic
5.0%
Immigrants | Immigrants
2.3
/100
|
#233
Tragic
5.0%
Immigrants | Southern Europe
1.8
/100
|
#234
Tragic
5.0%
Immigrants | Hong Kong
1.4
/100
|
#235
Tragic
5.0%
Immigrants | Albania
1.3
/100
|
#236
Tragic
5.0%
Choctaw
1.3
/100
|
#237
Tragic
5.0%

Demographics Similar to Afghans by Unemployment Among Ages 55 to 59 years

In terms of unemployment among ages 55 to 59 years, the demographic groups most similar to Afghans are Austrian (4.7%, a difference of 0.040%), Immigrants from Spain (4.7%, a difference of 0.10%), Egyptian (4.7%, a difference of 0.11%), Bangladeshi (4.7%, a difference of 0.11%), and French (4.7%, a difference of 0.17%).
DemographicsRating | RankUnemployment Among Ages 55 to 59 years
Immigrants | North America
93.9
/100
|
#105
Exceptional
4.7%
Immigrants | Laos
93.9
/100
|
#106
Exceptional
4.7%
Immigrants | Egypt
93.5
/100
|
#107
Exceptional
4.7%
French
93.3
/100
|
#108
Exceptional
4.7%
Chileans
93.2
/100
|
#109
Exceptional
4.7%
Egyptians
92.9
/100
|
#110
Exceptional
4.7%
Austrians
92.4
/100
|
#111
Exceptional
4.7%
Afghans
92.1
/100
|
#112
Exceptional
4.7%
Immigrants | Spain
91.4
/100
|
#113
Exceptional
4.7%
Bangladeshis
91.3
/100
|
#114
Exceptional
4.7%
South American Indians
90.9
/100
|
#115
Exceptional
4.7%
Turks
90.9
/100
|
#116
Exceptional
4.7%
Asians
90.8
/100
|
#117
Exceptional
4.7%
Immigrants | Chile
90.7
/100
|
#118
Exceptional
4.7%
Whites/Caucasians
90.7
/100
|
#119
Exceptional
4.7%