Immigrants from St. Vincent and the Grenadines vs Immigrants from Albania Unemployment Among Ages 45 to 54 years
COMPARE
Immigrants from St. Vincent and the Grenadines
Immigrants from Albania
Unemployment Among Ages 45 to 54 years
Unemployment Among Ages 45 to 54 years Comparison
Immigrants from St. Vincent and the Grenadines
Immigrants from Albania
5.7%
UNEMPLOYMENT AMONG AGES 45 TO 54 YEARS
0.0/ 100
METRIC RATING
320th/ 347
METRIC RANK
4.8%
UNEMPLOYMENT AMONG AGES 45 TO 54 YEARS
0.9/ 100
METRIC RATING
245th/ 347
METRIC RANK
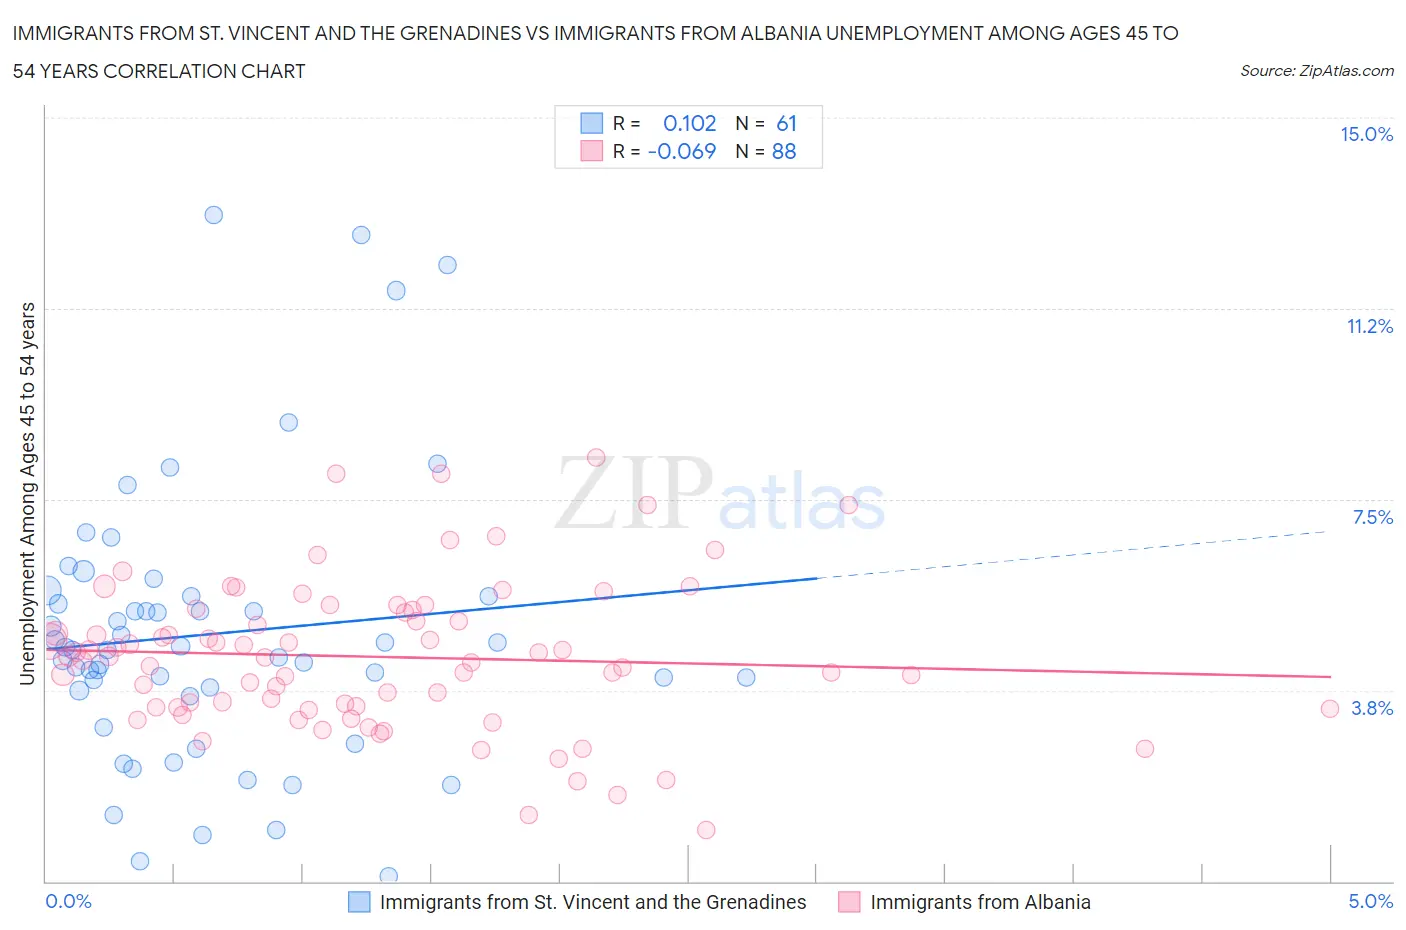
Immigrants from St. Vincent and the Grenadines vs Immigrants from Albania Unemployment Among Ages 45 to 54 years Correlation Chart
The statistical analysis conducted on geographies consisting of 56,012,006 people shows a poor positive correlation between the proportion of Immigrants from St. Vincent and the Grenadines and unemployment rate among population between the ages 45 and 54 in the United States with a correlation coefficient (R) of 0.102 and weighted average of 5.7%. Similarly, the statistical analysis conducted on geographies consisting of 118,397,124 people shows a slight negative correlation between the proportion of Immigrants from Albania and unemployment rate among population between the ages 45 and 54 in the United States with a correlation coefficient (R) of -0.069 and weighted average of 4.8%, a difference of 19.6%.
Unemployment Among Ages 45 to 54 years Correlation Summary
| Measurement | Immigrants from St. Vincent and the Grenadines | Immigrants from Albania |
| Minimum | 0.10% | 1.0% |
| Maximum | 13.1% | 8.3% |
| Range | 13.0% | 7.3% |
| Mean | 4.9% | 4.4% |
| Median | 4.5% | 4.4% |
| Interquartile 25% (IQ1) | 3.7% | 3.4% |
| Interquartile 75% (IQ3) | 5.6% | 5.3% |
| Interquartile Range (IQR) | 1.9% | 1.9% |
| Standard Deviation (Sample) | 2.7% | 1.5% |
| Standard Deviation (Population) | 2.7% | 1.5% |
Similar Demographics by Unemployment Among Ages 45 to 54 years
Demographics Similar to Immigrants from St. Vincent and the Grenadines by Unemployment Among Ages 45 to 54 years
In terms of unemployment among ages 45 to 54 years, the demographic groups most similar to Immigrants from St. Vincent and the Grenadines are Cape Verdean (5.7%, a difference of 0.010%), Yakama (5.7%, a difference of 0.35%), British West Indian (5.7%, a difference of 0.55%), Immigrants from the Azores (5.7%, a difference of 0.86%), and Houma (5.6%, a difference of 1.2%).
| Demographics | Rating | Rank | Unemployment Among Ages 45 to 54 years |
| Shoshone | 0.0 /100 | #313 | Tragic 5.6% |
| Guyanese | 0.0 /100 | #314 | Tragic 5.6% |
| Immigrants | Dominica | 0.0 /100 | #315 | Tragic 5.6% |
| Immigrants | Guyana | 0.0 /100 | #316 | Tragic 5.6% |
| Houma | 0.0 /100 | #317 | Tragic 5.6% |
| British West Indians | 0.0 /100 | #318 | Tragic 5.7% |
| Cape Verdeans | 0.0 /100 | #319 | Tragic 5.7% |
| Immigrants | St. Vincent and the Grenadines | 0.0 /100 | #320 | Tragic 5.7% |
| Yakama | 0.0 /100 | #321 | Tragic 5.7% |
| Immigrants | Azores | 0.0 /100 | #322 | Tragic 5.7% |
| Immigrants | Cabo Verde | 0.0 /100 | #323 | Tragic 5.9% |
| Natives/Alaskans | 0.0 /100 | #324 | Tragic 6.1% |
| Immigrants | Armenia | 0.0 /100 | #325 | Tragic 6.1% |
| Ute | 0.0 /100 | #326 | Tragic 6.2% |
| Dominicans | 0.0 /100 | #327 | Tragic 6.2% |
Demographics Similar to Immigrants from Albania by Unemployment Among Ages 45 to 54 years
In terms of unemployment among ages 45 to 54 years, the demographic groups most similar to Immigrants from Albania are Immigrants from Syria (4.8%, a difference of 0.010%), Israeli (4.8%, a difference of 0.060%), Seminole (4.8%, a difference of 0.15%), Immigrants from Liberia (4.8%, a difference of 0.17%), and Portuguese (4.8%, a difference of 0.21%).
| Demographics | Rating | Rank | Unemployment Among Ages 45 to 54 years |
| Yaqui | 1.4 /100 | #238 | Tragic 4.7% |
| Spanish Americans | 1.4 /100 | #239 | Tragic 4.7% |
| Immigrants | Iraq | 1.3 /100 | #240 | Tragic 4.7% |
| Delaware | 1.3 /100 | #241 | Tragic 4.8% |
| Central Americans | 1.3 /100 | #242 | Tragic 4.8% |
| Portuguese | 1.1 /100 | #243 | Tragic 4.8% |
| Seminole | 1.1 /100 | #244 | Tragic 4.8% |
| Immigrants | Albania | 0.9 /100 | #245 | Tragic 4.8% |
| Immigrants | Syria | 0.9 /100 | #246 | Tragic 4.8% |
| Israelis | 0.9 /100 | #247 | Tragic 4.8% |
| Immigrants | Liberia | 0.8 /100 | #248 | Tragic 4.8% |
| Immigrants | Honduras | 0.7 /100 | #249 | Tragic 4.8% |
| Salvadorans | 0.7 /100 | #250 | Tragic 4.8% |
| Hondurans | 0.4 /100 | #251 | Tragic 4.8% |
| Immigrants | Bahamas | 0.3 /100 | #252 | Tragic 4.8% |