Immigrants from St. Vincent and the Grenadines vs Haitian Unemployment Among Ages 16 to 19 years
COMPARE
Immigrants from St. Vincent and the Grenadines
Haitian
Unemployment Among Ages 16 to 19 years
Unemployment Among Ages 16 to 19 years Comparison
Immigrants from St. Vincent and the Grenadines
Haitians
25.7%
UNEMPLOYMENT AMONG AGES 16 TO 19 YEARS
0.0/ 100
METRIC RATING
338th/ 347
METRIC RANK
20.5%
UNEMPLOYMENT AMONG AGES 16 TO 19 YEARS
0.0/ 100
METRIC RATING
298th/ 347
METRIC RANK
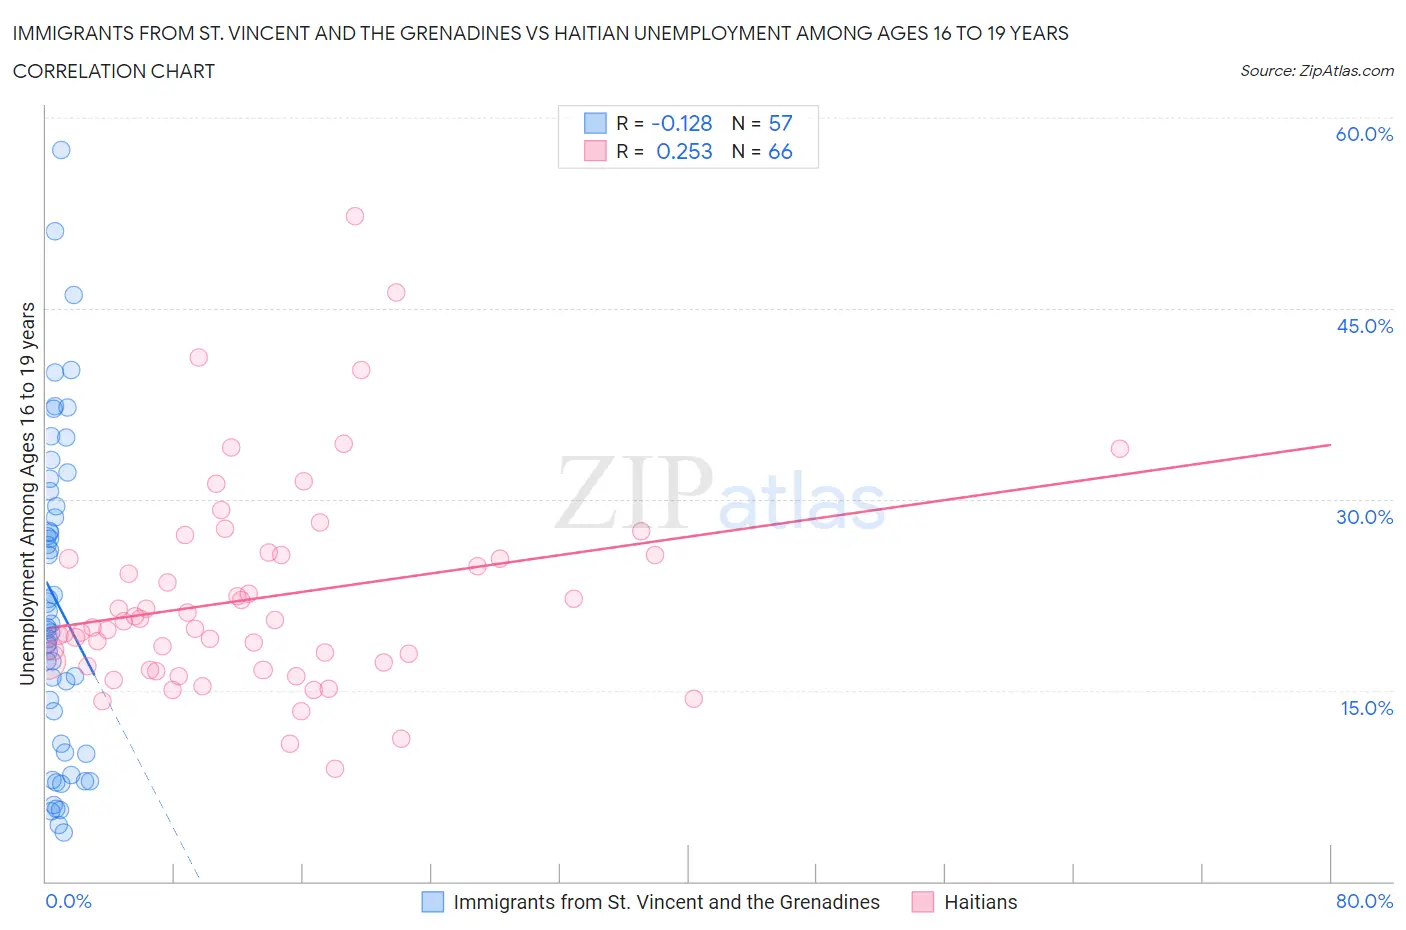
Immigrants from St. Vincent and the Grenadines vs Haitian Unemployment Among Ages 16 to 19 years Correlation Chart
The statistical analysis conducted on geographies consisting of 55,670,262 people shows a poor negative correlation between the proportion of Immigrants from St. Vincent and the Grenadines and unemployment rate among population between the ages 16 and 19 in the United States with a correlation coefficient (R) of -0.128 and weighted average of 25.7%. Similarly, the statistical analysis conducted on geographies consisting of 276,876,873 people shows a weak positive correlation between the proportion of Haitians and unemployment rate among population between the ages 16 and 19 in the United States with a correlation coefficient (R) of 0.253 and weighted average of 20.5%, a difference of 25.2%.
Unemployment Among Ages 16 to 19 years Correlation Summary
| Measurement | Immigrants from St. Vincent and the Grenadines | Haitian |
| Minimum | 3.8% | 8.8% |
| Maximum | 57.4% | 52.3% |
| Range | 53.6% | 43.5% |
| Mean | 21.9% | 22.2% |
| Median | 20.0% | 20.2% |
| Interquartile 25% (IQ1) | 10.4% | 16.9% |
| Interquartile 75% (IQ3) | 30.1% | 25.6% |
| Interquartile Range (IQR) | 19.6% | 8.7% |
| Standard Deviation (Sample) | 12.4% | 8.1% |
| Standard Deviation (Population) | 12.3% | 8.1% |
Similar Demographics by Unemployment Among Ages 16 to 19 years
Demographics Similar to Immigrants from St. Vincent and the Grenadines by Unemployment Among Ages 16 to 19 years
In terms of unemployment among ages 16 to 19 years, the demographic groups most similar to Immigrants from St. Vincent and the Grenadines are Immigrants from Grenada (25.7%, a difference of 0.19%), Immigrants from Guyana (25.5%, a difference of 0.81%), Kiowa (25.2%, a difference of 1.9%), Crow (26.2%, a difference of 2.1%), and Arapaho (25.2%, a difference of 2.1%).
| Demographics | Rating | Rank | Unemployment Among Ages 16 to 19 years |
| British West Indians | 0.0 /100 | #331 | Tragic 24.0% |
| Immigrants | Barbados | 0.0 /100 | #332 | Tragic 24.0% |
| Paiute | 0.0 /100 | #333 | Tragic 24.4% |
| Guyanese | 0.0 /100 | #334 | Tragic 24.8% |
| Arapaho | 0.0 /100 | #335 | Tragic 25.2% |
| Kiowa | 0.0 /100 | #336 | Tragic 25.2% |
| Immigrants | Guyana | 0.0 /100 | #337 | Tragic 25.5% |
| Immigrants | St. Vincent and the Grenadines | 0.0 /100 | #338 | Tragic 25.7% |
| Immigrants | Grenada | 0.0 /100 | #339 | Tragic 25.7% |
| Crow | 0.0 /100 | #340 | Tragic 26.2% |
| Puerto Ricans | 0.0 /100 | #341 | Tragic 27.5% |
| Inupiat | 0.0 /100 | #342 | Tragic 28.1% |
| Navajo | 0.0 /100 | #343 | Tragic 29.0% |
| Colville | 0.0 /100 | #344 | Tragic 29.7% |
| Hopi | 0.0 /100 | #345 | Tragic 30.7% |
Demographics Similar to Haitians by Unemployment Among Ages 16 to 19 years
In terms of unemployment among ages 16 to 19 years, the demographic groups most similar to Haitians are Immigrants from Uzbekistan (20.5%, a difference of 0.050%), Alsatian (20.5%, a difference of 0.060%), Armenian (20.5%, a difference of 0.080%), Ecuadorian (20.5%, a difference of 0.14%), and Central American Indian (20.4%, a difference of 0.38%).
| Demographics | Rating | Rank | Unemployment Among Ages 16 to 19 years |
| Immigrants | Yemen | 0.0 /100 | #291 | Tragic 20.0% |
| Comanche | 0.0 /100 | #292 | Tragic 20.2% |
| Immigrants | Bahamas | 0.0 /100 | #293 | Tragic 20.4% |
| Immigrants | Haiti | 0.0 /100 | #294 | Tragic 20.4% |
| Central American Indians | 0.0 /100 | #295 | Tragic 20.4% |
| Armenians | 0.0 /100 | #296 | Tragic 20.5% |
| Alsatians | 0.0 /100 | #297 | Tragic 20.5% |
| Haitians | 0.0 /100 | #298 | Tragic 20.5% |
| Immigrants | Uzbekistan | 0.0 /100 | #299 | Tragic 20.5% |
| Ecuadorians | 0.0 /100 | #300 | Tragic 20.5% |
| Immigrants | Ecuador | 0.0 /100 | #301 | Tragic 20.9% |
| Immigrants | Caribbean | 0.0 /100 | #302 | Tragic 20.9% |
| Senegalese | 0.0 /100 | #303 | Tragic 21.0% |
| Aleuts | 0.0 /100 | #304 | Tragic 21.2% |
| Immigrants | Senegal | 0.0 /100 | #305 | Tragic 21.2% |