Immigrants from St. Vincent and the Grenadines vs Ghanaian Unemployment Among Ages 55 to 59 years
COMPARE
Immigrants from St. Vincent and the Grenadines
Ghanaian
Unemployment Among Ages 55 to 59 years
Unemployment Among Ages 55 to 59 years Comparison
Immigrants from St. Vincent and the Grenadines
Ghanaians
5.4%
UNEMPLOYMENT AMONG AGES 55 TO 59 YEARS
0.0/ 100
METRIC RATING
300th/ 347
METRIC RANK
5.3%
UNEMPLOYMENT AMONG AGES 55 TO 59 YEARS
0.0/ 100
METRIC RATING
284th/ 347
METRIC RANK
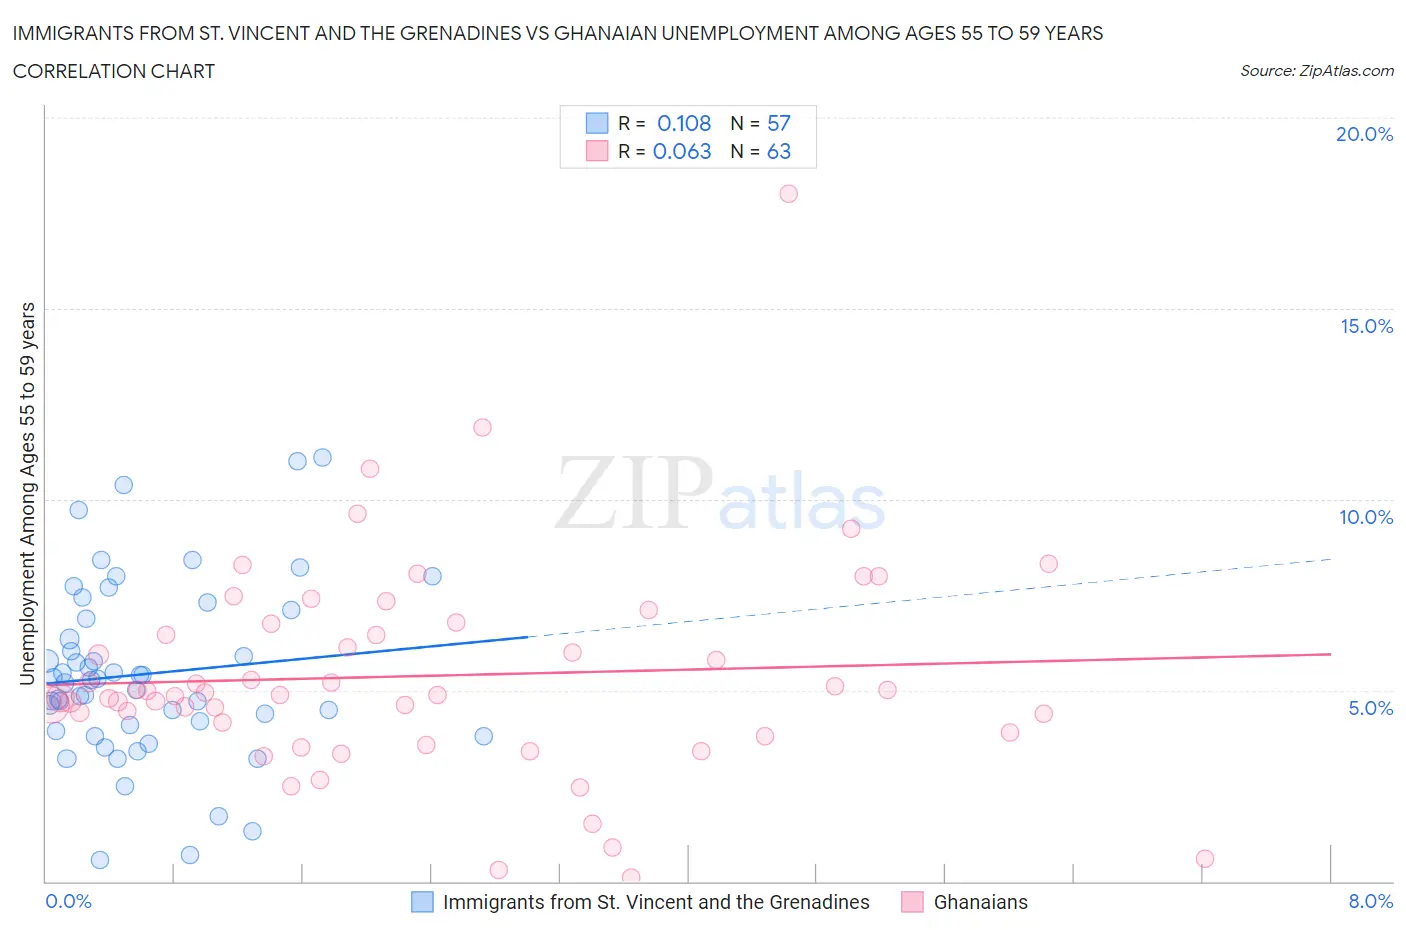
Immigrants from St. Vincent and the Grenadines vs Ghanaian Unemployment Among Ages 55 to 59 years Correlation Chart
The statistical analysis conducted on geographies consisting of 55,304,746 people shows a poor positive correlation between the proportion of Immigrants from St. Vincent and the Grenadines and unemployment rate among population between the ages 55 and 59 in the United States with a correlation coefficient (R) of 0.108 and weighted average of 5.4%. Similarly, the statistical analysis conducted on geographies consisting of 184,325,244 people shows a slight positive correlation between the proportion of Ghanaians and unemployment rate among population between the ages 55 and 59 in the United States with a correlation coefficient (R) of 0.063 and weighted average of 5.3%, a difference of 3.0%.
Unemployment Among Ages 55 to 59 years Correlation Summary
| Measurement | Immigrants from St. Vincent and the Grenadines | Ghanaian |
| Minimum | 0.57% | 0.10% |
| Maximum | 11.1% | 18.0% |
| Range | 10.5% | 17.9% |
| Mean | 5.4% | 5.4% |
| Median | 5.3% | 4.9% |
| Interquartile 25% (IQ1) | 4.0% | 3.9% |
| Interquartile 75% (IQ3) | 7.0% | 6.7% |
| Interquartile Range (IQR) | 3.0% | 2.8% |
| Standard Deviation (Sample) | 2.3% | 2.8% |
| Standard Deviation (Population) | 2.3% | 2.8% |
Demographics Similar to Immigrants from St. Vincent and the Grenadines and Ghanaians by Unemployment Among Ages 55 to 59 years
In terms of unemployment among ages 55 to 59 years, the demographic groups most similar to Immigrants from St. Vincent and the Grenadines are Cape Verdean (5.4%, a difference of 0.14%), Immigrants from Dominica (5.5%, a difference of 0.24%), Sierra Leonean (5.5%, a difference of 0.64%), Hispanic or Latino (5.4%, a difference of 1.3%), and Immigrants from Mexico (5.3%, a difference of 1.7%). Similarly, the demographic groups most similar to Ghanaians are Apache (5.3%, a difference of 0.040%), Immigrants from Trinidad and Tobago (5.3%, a difference of 0.080%), Armenian (5.3%, a difference of 0.10%), Immigrants from Ghana (5.3%, a difference of 0.22%), and Immigrants from Guatemala (5.3%, a difference of 0.24%).
| Demographics | Rating | Rank | Unemployment Among Ages 55 to 59 years |
| Immigrants | Trinidad and Tobago | 0.0 /100 | #282 | Tragic 5.3% |
| Apache | 0.0 /100 | #283 | Tragic 5.3% |
| Ghanaians | 0.0 /100 | #284 | Tragic 5.3% |
| Armenians | 0.0 /100 | #285 | Tragic 5.3% |
| Immigrants | Ghana | 0.0 /100 | #286 | Tragic 5.3% |
| Immigrants | Guatemala | 0.0 /100 | #287 | Tragic 5.3% |
| Immigrants | Israel | 0.0 /100 | #288 | Tragic 5.3% |
| Immigrants | Central America | 0.0 /100 | #289 | Tragic 5.3% |
| Sioux | 0.0 /100 | #290 | Tragic 5.3% |
| Trinidadians and Tobagonians | 0.0 /100 | #291 | Tragic 5.3% |
| British West Indians | 0.0 /100 | #292 | Tragic 5.3% |
| Immigrants | Grenada | 0.0 /100 | #293 | Tragic 5.3% |
| Cajuns | 0.0 /100 | #294 | Tragic 5.3% |
| Dutch West Indians | 0.0 /100 | #295 | Tragic 5.3% |
| Barbadians | 0.0 /100 | #296 | Tragic 5.3% |
| Immigrants | Mexico | 0.0 /100 | #297 | Tragic 5.3% |
| Hispanics or Latinos | 0.0 /100 | #298 | Tragic 5.4% |
| Cape Verdeans | 0.0 /100 | #299 | Tragic 5.4% |
| Immigrants | St. Vincent and the Grenadines | 0.0 /100 | #300 | Tragic 5.4% |
| Immigrants | Dominica | 0.0 /100 | #301 | Tragic 5.5% |
| Sierra Leoneans | 0.0 /100 | #302 | Tragic 5.5% |