Immigrants from Spain vs Immigrants from Yemen Unemployment Among Ages 16 to 19 years
COMPARE
Immigrants from Spain
Immigrants from Yemen
Unemployment Among Ages 16 to 19 years
Unemployment Among Ages 16 to 19 years Comparison
Immigrants from Spain
Immigrants from Yemen
18.0%
UNEMPLOYMENT AMONG AGES 16 TO 19 YEARS
11.4/ 100
METRIC RATING
221st/ 347
METRIC RANK
20.0%
UNEMPLOYMENT AMONG AGES 16 TO 19 YEARS
0.0/ 100
METRIC RATING
291st/ 347
METRIC RANK
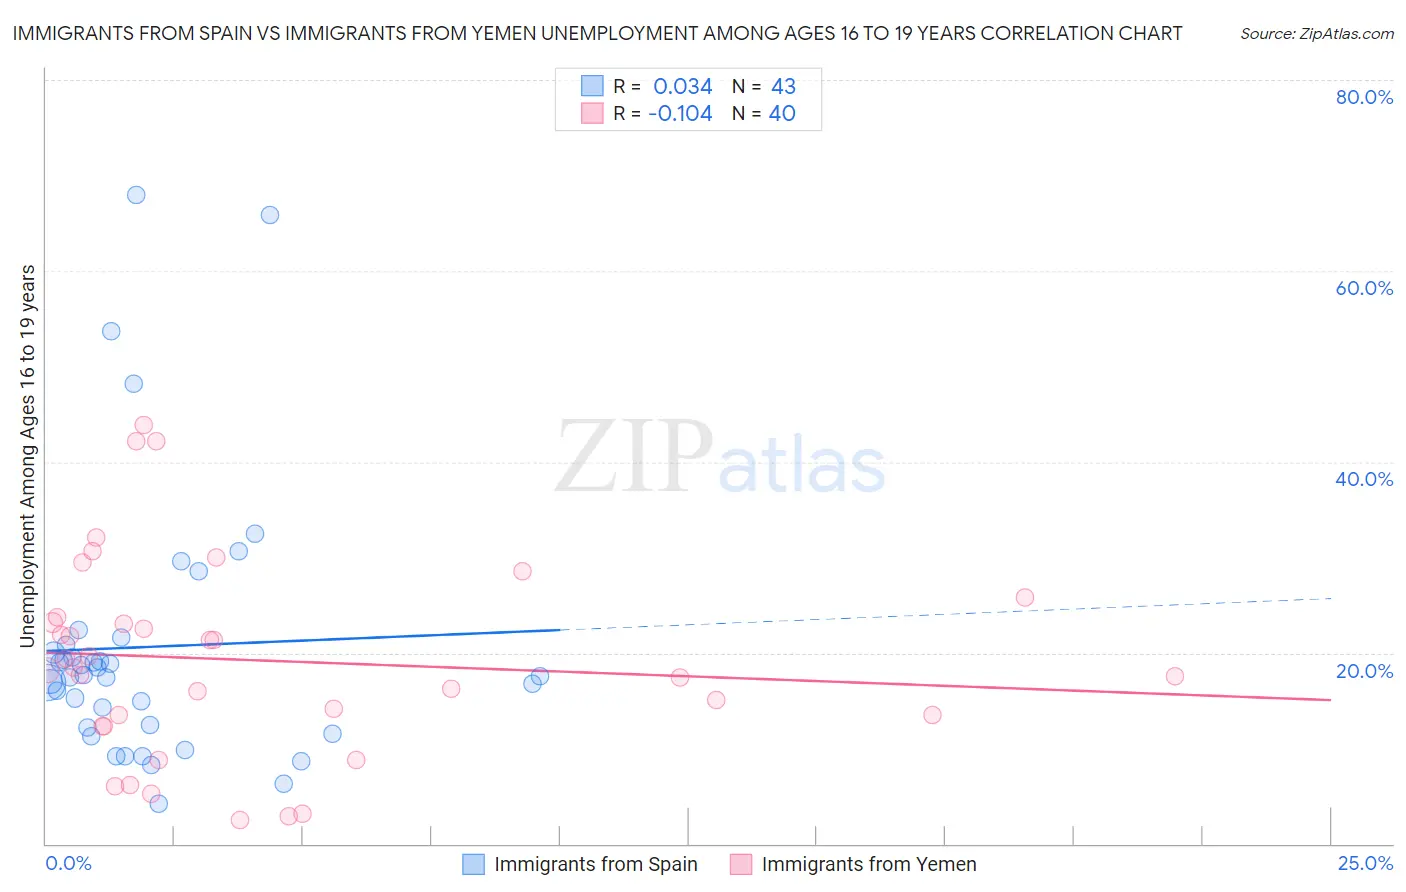
Immigrants from Spain vs Immigrants from Yemen Unemployment Among Ages 16 to 19 years Correlation Chart
The statistical analysis conducted on geographies consisting of 231,740,875 people shows no correlation between the proportion of Immigrants from Spain and unemployment rate among population between the ages 16 and 19 in the United States with a correlation coefficient (R) of 0.034 and weighted average of 18.0%. Similarly, the statistical analysis conducted on geographies consisting of 81,680,406 people shows a poor negative correlation between the proportion of Immigrants from Yemen and unemployment rate among population between the ages 16 and 19 in the United States with a correlation coefficient (R) of -0.104 and weighted average of 20.0%, a difference of 11.3%.
Unemployment Among Ages 16 to 19 years Correlation Summary
| Measurement | Immigrants from Spain | Immigrants from Yemen |
| Minimum | 4.2% | 2.5% |
| Maximum | 68.0% | 43.9% |
| Range | 63.7% | 41.4% |
| Mean | 20.6% | 19.2% |
| Median | 17.6% | 18.3% |
| Interquartile 25% (IQ1) | 12.2% | 12.9% |
| Interquartile 75% (IQ3) | 20.9% | 23.5% |
| Interquartile Range (IQR) | 8.7% | 10.6% |
| Standard Deviation (Sample) | 14.1% | 10.4% |
| Standard Deviation (Population) | 13.9% | 10.2% |
Similar Demographics by Unemployment Among Ages 16 to 19 years
Demographics Similar to Immigrants from Spain by Unemployment Among Ages 16 to 19 years
In terms of unemployment among ages 16 to 19 years, the demographic groups most similar to Immigrants from Spain are Immigrants from Albania (18.0%, a difference of 0.0%), Immigrants from Africa (18.0%, a difference of 0.060%), Immigrants from Iran (18.0%, a difference of 0.090%), Immigrants from Argentina (18.0%, a difference of 0.12%), and Immigrants from Western Asia (18.0%, a difference of 0.14%).
| Demographics | Rating | Rank | Unemployment Among Ages 16 to 19 years |
| Immigrants | Morocco | 13.5 /100 | #214 | Poor 18.0% |
| Immigrants | Syria | 13.3 /100 | #215 | Poor 18.0% |
| Immigrants | Kazakhstan | 13.0 /100 | #216 | Poor 18.0% |
| South American Indians | 13.0 /100 | #217 | Poor 18.0% |
| Immigrants | Argentina | 12.5 /100 | #218 | Poor 18.0% |
| Immigrants | Africa | 12.0 /100 | #219 | Poor 18.0% |
| Immigrants | Albania | 11.4 /100 | #220 | Poor 18.0% |
| Immigrants | Spain | 11.4 /100 | #221 | Poor 18.0% |
| Immigrants | Iran | 10.7 /100 | #222 | Poor 18.0% |
| Immigrants | Western Asia | 10.2 /100 | #223 | Poor 18.0% |
| Immigrants | Serbia | 8.3 /100 | #224 | Tragic 18.1% |
| Immigrants | Chile | 7.5 /100 | #225 | Tragic 18.1% |
| Immigrants | Belgium | 7.3 /100 | #226 | Tragic 18.1% |
| Immigrants | Liberia | 7.1 /100 | #227 | Tragic 18.1% |
| Immigrants | Greece | 7.1 /100 | #228 | Tragic 18.1% |
Demographics Similar to Immigrants from Yemen by Unemployment Among Ages 16 to 19 years
In terms of unemployment among ages 16 to 19 years, the demographic groups most similar to Immigrants from Yemen are Immigrants from Sierra Leone (20.0%, a difference of 0.43%), Pueblo (19.8%, a difference of 0.96%), Comanche (20.2%, a difference of 1.0%), Immigrants from the Azores (19.8%, a difference of 1.1%), and Immigrants from Ghana (19.8%, a difference of 1.3%).
| Demographics | Rating | Rank | Unemployment Among Ages 16 to 19 years |
| Sierra Leoneans | 0.0 /100 | #284 | Tragic 19.7% |
| Ghanaians | 0.0 /100 | #285 | Tragic 19.8% |
| Bahamians | 0.0 /100 | #286 | Tragic 19.8% |
| Immigrants | Ghana | 0.0 /100 | #287 | Tragic 19.8% |
| Immigrants | Azores | 0.0 /100 | #288 | Tragic 19.8% |
| Pueblo | 0.0 /100 | #289 | Tragic 19.8% |
| Immigrants | Sierra Leone | 0.0 /100 | #290 | Tragic 20.0% |
| Immigrants | Yemen | 0.0 /100 | #291 | Tragic 20.0% |
| Comanche | 0.0 /100 | #292 | Tragic 20.2% |
| Immigrants | Bahamas | 0.0 /100 | #293 | Tragic 20.4% |
| Immigrants | Haiti | 0.0 /100 | #294 | Tragic 20.4% |
| Central American Indians | 0.0 /100 | #295 | Tragic 20.4% |
| Armenians | 0.0 /100 | #296 | Tragic 20.5% |
| Alsatians | 0.0 /100 | #297 | Tragic 20.5% |
| Haitians | 0.0 /100 | #298 | Tragic 20.5% |