Immigrants from Spain vs Immigrants from Bosnia and Herzegovina Unemployment Among Ages 65 to 74 years
COMPARE
Immigrants from Spain
Immigrants from Bosnia and Herzegovina
Unemployment Among Ages 65 to 74 years
Unemployment Among Ages 65 to 74 years Comparison
Immigrants from Spain
Immigrants from Bosnia and Herzegovina
5.4%
UNEMPLOYMENT AMONG AGES 65 TO 74 YEARS
37.3/ 100
METRIC RATING
183rd/ 347
METRIC RANK
5.3%
UNEMPLOYMENT AMONG AGES 65 TO 74 YEARS
60.2/ 100
METRIC RATING
165th/ 347
METRIC RANK
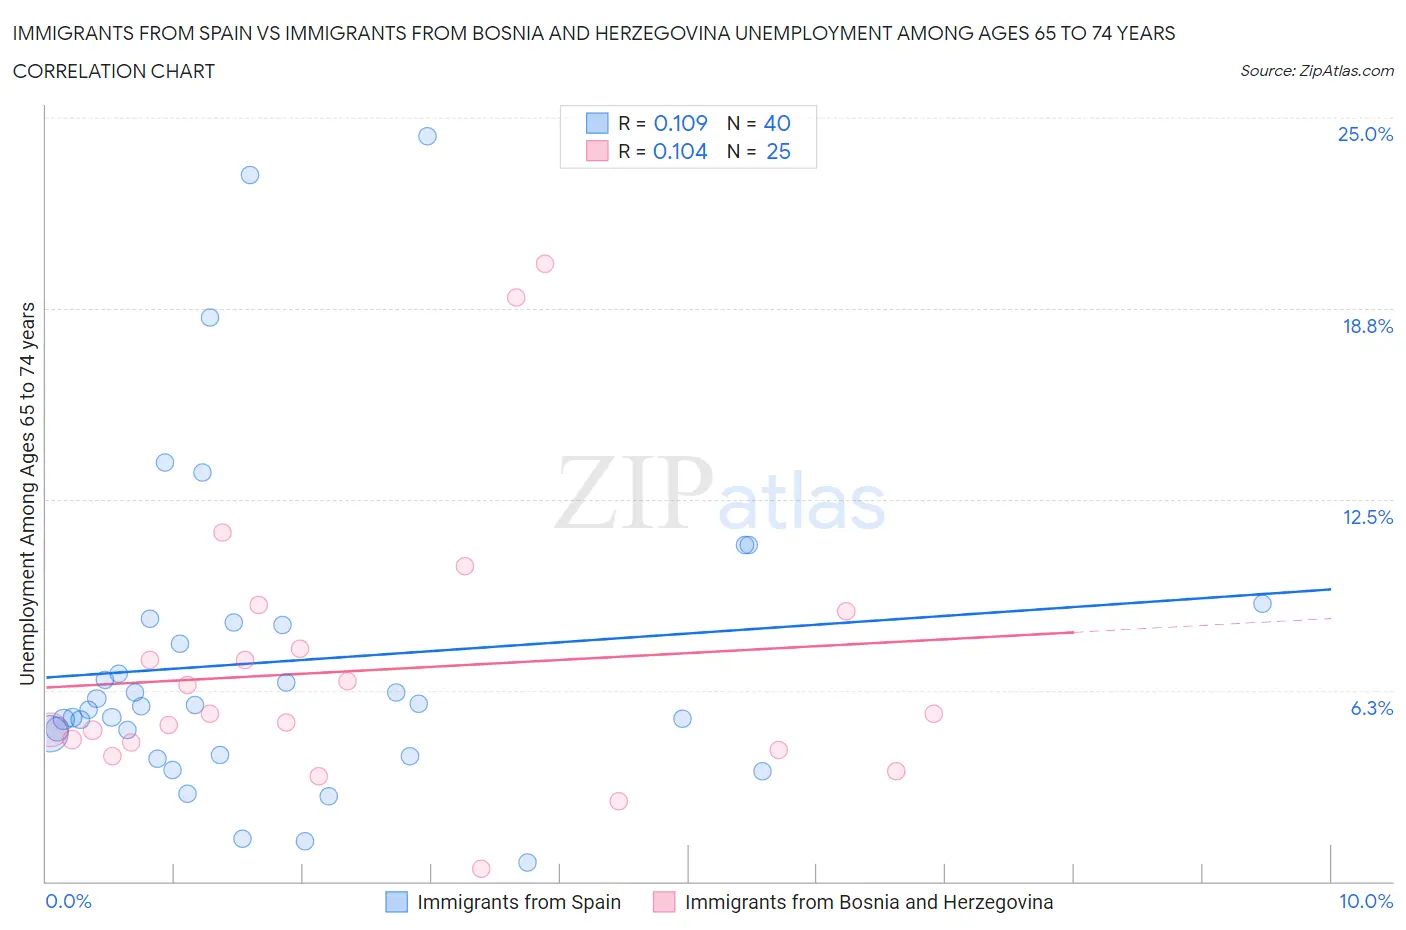
Immigrants from Spain vs Immigrants from Bosnia and Herzegovina Unemployment Among Ages 65 to 74 years Correlation Chart
The statistical analysis conducted on geographies consisting of 223,058,481 people shows a poor positive correlation between the proportion of Immigrants from Spain and unemployment rate among population between the ages 65 and 74 in the United States with a correlation coefficient (R) of 0.109 and weighted average of 5.4%. Similarly, the statistical analysis conducted on geographies consisting of 147,656,848 people shows a poor positive correlation between the proportion of Immigrants from Bosnia and Herzegovina and unemployment rate among population between the ages 65 and 74 in the United States with a correlation coefficient (R) of 0.104 and weighted average of 5.3%, a difference of 0.78%.
Unemployment Among Ages 65 to 74 years Correlation Summary
| Measurement | Immigrants from Spain | Immigrants from Bosnia and Herzegovina |
| Minimum | 0.60% | 0.40% |
| Maximum | 24.4% | 20.2% |
| Range | 23.8% | 19.8% |
| Mean | 7.2% | 6.9% |
| Median | 5.8% | 5.5% |
| Interquartile 25% (IQ1) | 4.5% | 4.4% |
| Interquartile 75% (IQ3) | 8.4% | 8.2% |
| Interquartile Range (IQR) | 4.0% | 3.8% |
| Standard Deviation (Sample) | 5.2% | 4.5% |
| Standard Deviation (Population) | 5.1% | 4.4% |
Demographics Similar to Immigrants from Spain and Immigrants from Bosnia and Herzegovina by Unemployment Among Ages 65 to 74 years
In terms of unemployment among ages 65 to 74 years, the demographic groups most similar to Immigrants from Spain are Spanish American (5.4%, a difference of 0.030%), Immigrants from Senegal (5.4%, a difference of 0.080%), Soviet Union (5.4%, a difference of 0.090%), Immigrants from Ireland (5.4%, a difference of 0.16%), and Guamanian/Chamorro (5.4%, a difference of 0.17%). Similarly, the demographic groups most similar to Immigrants from Bosnia and Herzegovina are Slovak (5.3%, a difference of 0.010%), Indian (Asian) (5.3%, a difference of 0.010%), Immigrants from Philippines (5.3%, a difference of 0.040%), White/Caucasian (5.4%, a difference of 0.11%), and Laotian (5.4%, a difference of 0.15%).
| Demographics | Rating | Rank | Unemployment Among Ages 65 to 74 years |
| Immigrants | Philippines | 61.2 /100 | #164 | Good 5.3% |
| Immigrants | Bosnia and Herzegovina | 60.2 /100 | #165 | Good 5.3% |
| Slovaks | 60.0 /100 | #166 | Good 5.3% |
| Indians (Asian) | 59.9 /100 | #167 | Average 5.3% |
| Whites/Caucasians | 57.2 /100 | #168 | Average 5.4% |
| Laotians | 55.7 /100 | #169 | Average 5.4% |
| Syrians | 53.7 /100 | #170 | Average 5.4% |
| Panamanians | 51.8 /100 | #171 | Average 5.4% |
| Greeks | 51.1 /100 | #172 | Average 5.4% |
| Immigrants | Northern Europe | 51.1 /100 | #173 | Average 5.4% |
| Potawatomi | 50.0 /100 | #174 | Average 5.4% |
| Immigrants | Iran | 49.0 /100 | #175 | Average 5.4% |
| Immigrants | Western Europe | 47.3 /100 | #176 | Average 5.4% |
| Arabs | 46.8 /100 | #177 | Average 5.4% |
| French | 43.1 /100 | #178 | Average 5.4% |
| Guamanians/Chamorros | 42.1 /100 | #179 | Average 5.4% |
| Immigrants | Ireland | 42.0 /100 | #180 | Average 5.4% |
| Soviet Union | 40.0 /100 | #181 | Fair 5.4% |
| Spanish Americans | 38.2 /100 | #182 | Fair 5.4% |
| Immigrants | Spain | 37.3 /100 | #183 | Fair 5.4% |
| Immigrants | Senegal | 35.2 /100 | #184 | Fair 5.4% |