Immigrants from Spain vs Argentinean Unemployment Among Ages 30 to 34 years
COMPARE
Immigrants from Spain
Argentinean
Unemployment Among Ages 30 to 34 years
Unemployment Among Ages 30 to 34 years Comparison
Immigrants from Spain
Argentineans
5.3%
UNEMPLOYMENT AMONG AGES 30 TO 34 YEARS
85.6/ 100
METRIC RATING
113th/ 347
METRIC RANK
5.3%
UNEMPLOYMENT AMONG AGES 30 TO 34 YEARS
87.9/ 100
METRIC RATING
105th/ 347
METRIC RANK
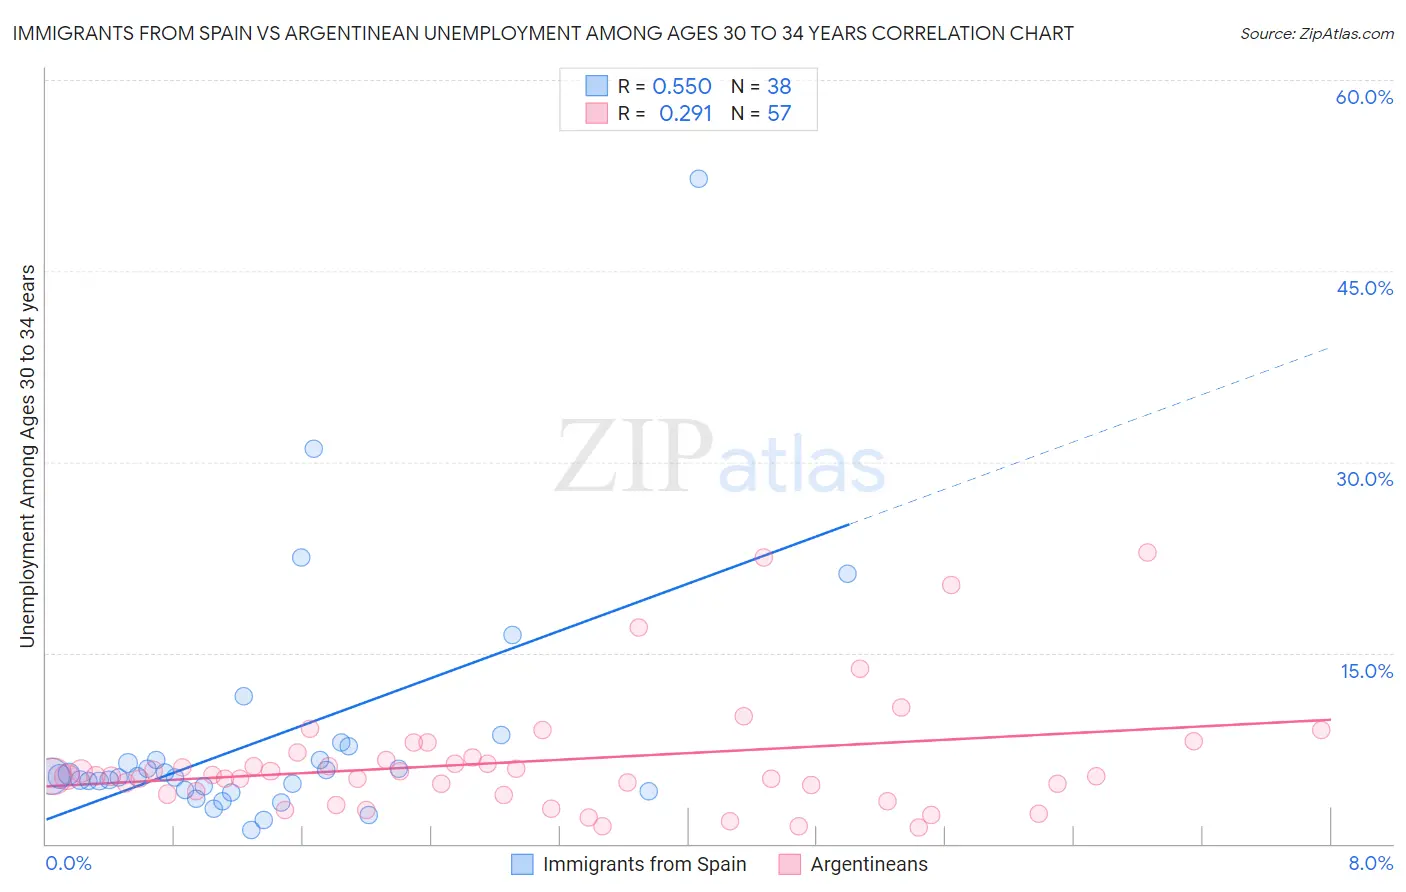
Immigrants from Spain vs Argentinean Unemployment Among Ages 30 to 34 years Correlation Chart
The statistical analysis conducted on geographies consisting of 231,978,822 people shows a substantial positive correlation between the proportion of Immigrants from Spain and unemployment rate among population between the ages 30 and 34 in the United States with a correlation coefficient (R) of 0.550 and weighted average of 5.3%. Similarly, the statistical analysis conducted on geographies consisting of 285,989,104 people shows a weak positive correlation between the proportion of Argentineans and unemployment rate among population between the ages 30 and 34 in the United States with a correlation coefficient (R) of 0.291 and weighted average of 5.3%, a difference of 0.36%.
Unemployment Among Ages 30 to 34 years Correlation Summary
| Measurement | Immigrants from Spain | Argentinean |
| Minimum | 1.1% | 1.3% |
| Maximum | 52.2% | 22.9% |
| Range | 51.1% | 21.6% |
| Mean | 8.2% | 6.5% |
| Median | 5.3% | 5.3% |
| Interquartile 25% (IQ1) | 4.2% | 4.0% |
| Interquartile 75% (IQ3) | 6.6% | 6.9% |
| Interquartile Range (IQR) | 2.4% | 2.9% |
| Standard Deviation (Sample) | 9.5% | 4.6% |
| Standard Deviation (Population) | 9.4% | 4.6% |
Demographics Similar to Immigrants from Spain and Argentineans by Unemployment Among Ages 30 to 34 years
In terms of unemployment among ages 30 to 34 years, the demographic groups most similar to Immigrants from Spain are Swiss (5.3%, a difference of 0.060%), Immigrants from Pakistan (5.3%, a difference of 0.10%), Egyptian (5.3%, a difference of 0.12%), Immigrants from Chile (5.3%, a difference of 0.17%), and Immigrants from Middle Africa (5.3%, a difference of 0.23%). Similarly, the demographic groups most similar to Argentineans are Northern European (5.3%, a difference of 0.0%), Croatian (5.3%, a difference of 0.050%), Icelander (5.3%, a difference of 0.11%), Immigrants from Middle Africa (5.3%, a difference of 0.12%), and Immigrants from Jordan (5.3%, a difference of 0.16%).
| Demographics | Rating | Rank | Unemployment Among Ages 30 to 34 years |
| Immigrants | Ireland | 90.6 /100 | #99 | Exceptional 5.2% |
| Immigrants | Czechoslovakia | 89.5 /100 | #100 | Excellent 5.3% |
| British | 89.1 /100 | #101 | Excellent 5.3% |
| Immigrants | Switzerland | 88.8 /100 | #102 | Excellent 5.3% |
| Immigrants | Jordan | 88.8 /100 | #103 | Excellent 5.3% |
| Northern Europeans | 87.9 /100 | #104 | Excellent 5.3% |
| Argentineans | 87.9 /100 | #105 | Excellent 5.3% |
| Croatians | 87.6 /100 | #106 | Excellent 5.3% |
| Icelanders | 87.2 /100 | #107 | Excellent 5.3% |
| Immigrants | Middle Africa | 87.1 /100 | #108 | Excellent 5.3% |
| Immigrants | Chile | 86.7 /100 | #109 | Excellent 5.3% |
| Egyptians | 86.4 /100 | #110 | Excellent 5.3% |
| Immigrants | Pakistan | 86.2 /100 | #111 | Excellent 5.3% |
| Swiss | 85.9 /100 | #112 | Excellent 5.3% |
| Immigrants | Spain | 85.6 /100 | #113 | Excellent 5.3% |
| Estonians | 83.7 /100 | #114 | Excellent 5.3% |
| Immigrants | Albania | 83.4 /100 | #115 | Excellent 5.3% |
| Eastern Europeans | 83.2 /100 | #116 | Excellent 5.3% |
| Australians | 83.1 /100 | #117 | Excellent 5.3% |
| Immigrants | South Africa | 83.0 /100 | #118 | Excellent 5.3% |
| New Zealanders | 82.5 /100 | #119 | Excellent 5.3% |