Immigrants from South Eastern Asia vs Yaqui Unemployment Among Youth under 25 years
COMPARE
Immigrants from South Eastern Asia
Yaqui
Unemployment Among Youth under 25 years
Unemployment Among Youth under 25 years Comparison
Immigrants from South Eastern Asia
Yaqui
11.6%
UNEMPLOYMENT AMONG YOUTH UNDER 25 YEARS
51.7/ 100
METRIC RATING
173rd/ 347
METRIC RANK
11.9%
UNEMPLOYMENT AMONG YOUTH UNDER 25 YEARS
6.9/ 100
METRIC RATING
217th/ 347
METRIC RANK
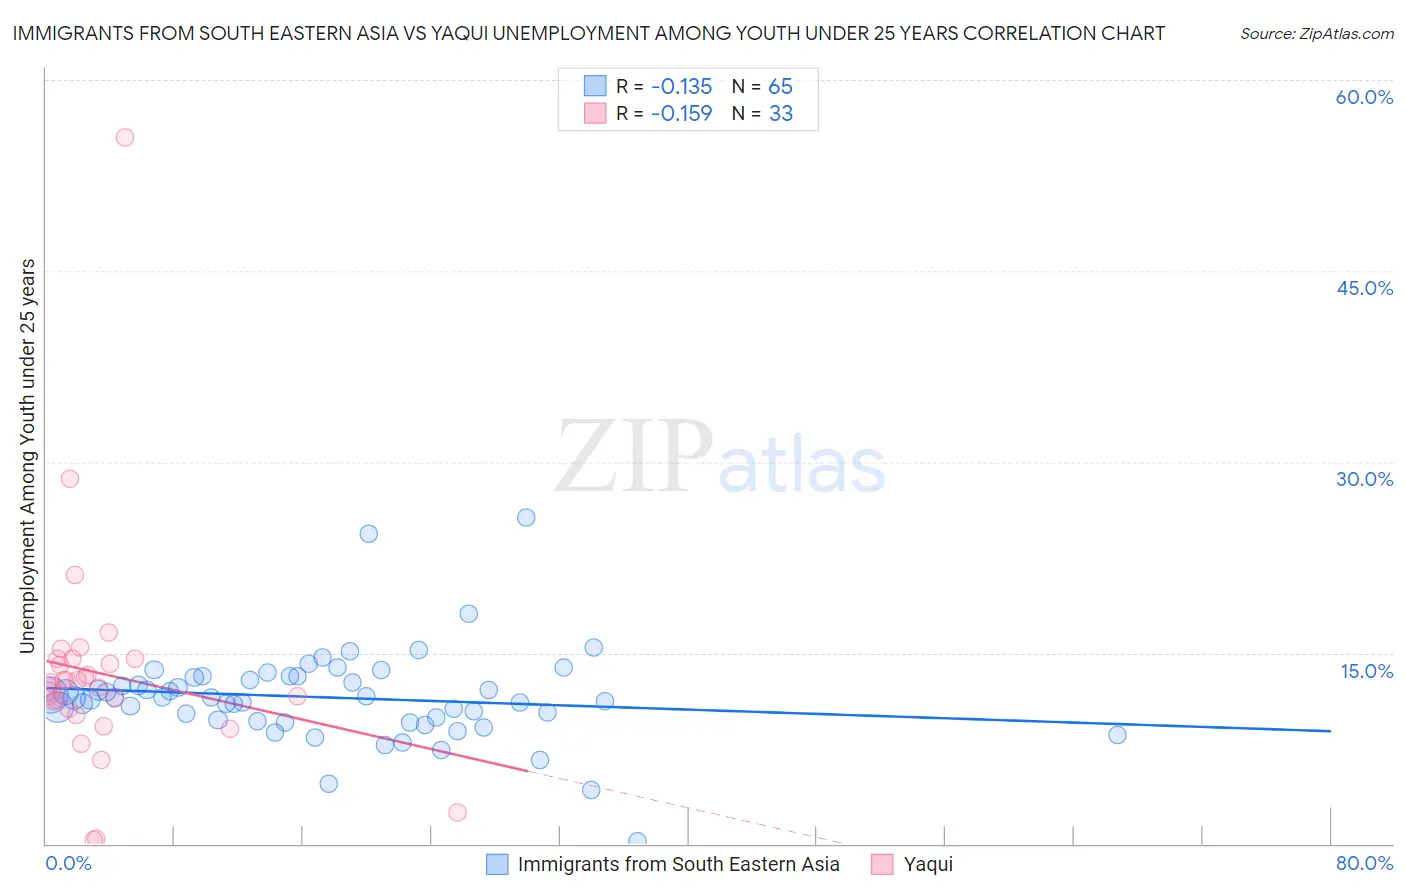
Immigrants from South Eastern Asia vs Yaqui Unemployment Among Youth under 25 years Correlation Chart
The statistical analysis conducted on geographies consisting of 501,285,462 people shows a poor negative correlation between the proportion of Immigrants from South Eastern Asia and unemployment rate among youth under the age of 25 in the United States with a correlation coefficient (R) of -0.135 and weighted average of 11.6%. Similarly, the statistical analysis conducted on geographies consisting of 107,339,892 people shows a poor negative correlation between the proportion of Yaqui and unemployment rate among youth under the age of 25 in the United States with a correlation coefficient (R) of -0.159 and weighted average of 11.9%, a difference of 2.7%.
Unemployment Among Youth under 25 years Correlation Summary
| Measurement | Immigrants from South Eastern Asia | Yaqui |
| Minimum | 0.20% | 0.30% |
| Maximum | 25.6% | 55.5% |
| Range | 25.4% | 55.2% |
| Mean | 11.5% | 13.3% |
| Median | 11.5% | 12.6% |
| Interquartile 25% (IQ1) | 9.6% | 10.4% |
| Interquartile 75% (IQ3) | 13.1% | 14.5% |
| Interquartile Range (IQR) | 3.5% | 4.1% |
| Standard Deviation (Sample) | 3.7% | 9.2% |
| Standard Deviation (Population) | 3.7% | 9.0% |
Similar Demographics by Unemployment Among Youth under 25 years
Demographics Similar to Immigrants from South Eastern Asia by Unemployment Among Youth under 25 years
In terms of unemployment among youth under 25 years, the demographic groups most similar to Immigrants from South Eastern Asia are Immigrants from China (11.6%, a difference of 0.070%), Immigrants from Morocco (11.6%, a difference of 0.14%), Bangladeshi (11.6%, a difference of 0.16%), Immigrants from Iraq (11.6%, a difference of 0.19%), and Russian (11.6%, a difference of 0.23%).
| Demographics | Rating | Rank | Unemployment Among Youth under 25 years |
| Spanish | 60.3 /100 | #166 | Good 11.6% |
| Okinawans | 58.7 /100 | #167 | Average 11.6% |
| Potawatomi | 57.9 /100 | #168 | Average 11.6% |
| Eastern Europeans | 57.5 /100 | #169 | Average 11.6% |
| Russians | 57.3 /100 | #170 | Average 11.6% |
| Bangladeshis | 55.6 /100 | #171 | Average 11.6% |
| Immigrants | Morocco | 55.1 /100 | #172 | Average 11.6% |
| Immigrants | South Eastern Asia | 51.7 /100 | #173 | Average 11.6% |
| Immigrants | China | 50.0 /100 | #174 | Average 11.6% |
| Immigrants | Iraq | 47.0 /100 | #175 | Average 11.6% |
| Ugandans | 45.6 /100 | #176 | Average 11.6% |
| Immigrants | Denmark | 45.0 /100 | #177 | Average 11.6% |
| Immigrants | Europe | 42.4 /100 | #178 | Average 11.6% |
| Immigrants | Hong Kong | 42.4 /100 | #179 | Average 11.6% |
| Spaniards | 39.8 /100 | #180 | Fair 11.7% |
Demographics Similar to Yaqui by Unemployment Among Youth under 25 years
In terms of unemployment among youth under 25 years, the demographic groups most similar to Yaqui are Guamanian/Chamorro (11.9%, a difference of 0.010%), Immigrants from Middle Africa (11.9%, a difference of 0.010%), Samoan (11.9%, a difference of 0.070%), Nonimmigrants (11.9%, a difference of 0.12%), and Alsatian (11.9%, a difference of 0.14%).
| Demographics | Rating | Rank | Unemployment Among Youth under 25 years |
| Assyrians/Chaldeans/Syriacs | 9.8 /100 | #210 | Tragic 11.9% |
| Immigrants | Philippines | 9.2 /100 | #211 | Tragic 11.9% |
| Colombians | 9.1 /100 | #212 | Tragic 11.9% |
| South Americans | 8.5 /100 | #213 | Tragic 11.9% |
| Costa Ricans | 8.2 /100 | #214 | Tragic 11.9% |
| Samoans | 7.4 /100 | #215 | Tragic 11.9% |
| Guamanians/Chamorros | 7.0 /100 | #216 | Tragic 11.9% |
| Yaqui | 6.9 /100 | #217 | Tragic 11.9% |
| Immigrants | Middle Africa | 6.8 /100 | #218 | Tragic 11.9% |
| Immigrants | Nonimmigrants | 6.2 /100 | #219 | Tragic 11.9% |
| Alsatians | 6.1 /100 | #220 | Tragic 11.9% |
| Immigrants | Portugal | 4.9 /100 | #221 | Tragic 12.0% |
| Israelis | 4.1 /100 | #222 | Tragic 12.0% |
| Immigrants | Ireland | 3.5 /100 | #223 | Tragic 12.0% |
| Hawaiians | 3.5 /100 | #224 | Tragic 12.0% |