Immigrants from South Central Asia vs Alaskan Athabascan Unemployment Among Ages 16 to 19 years
COMPARE
Immigrants from South Central Asia
Alaskan Athabascan
Unemployment Among Ages 16 to 19 years
Unemployment Among Ages 16 to 19 years Comparison
Immigrants from South Central Asia
Alaskan Athabascans
16.2%
UNEMPLOYMENT AMONG AGES 16 TO 19 YEARS
99.8/ 100
METRIC RATING
36th/ 347
METRIC RANK
17.7%
UNEMPLOYMENT AMONG AGES 16 TO 19 YEARS
34.1/ 100
METRIC RATING
196th/ 347
METRIC RANK
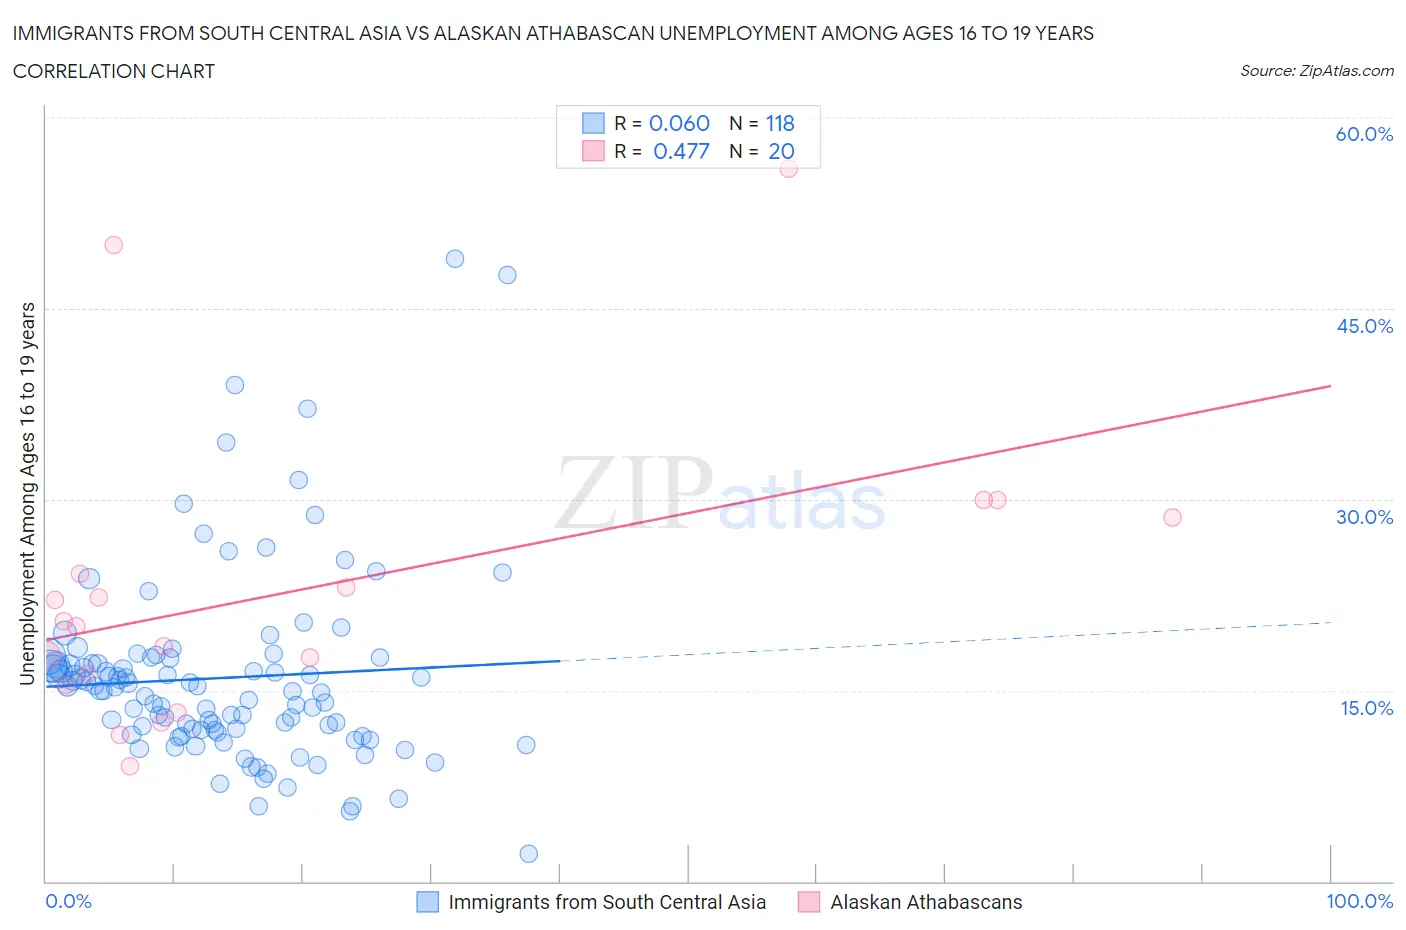
Immigrants from South Central Asia vs Alaskan Athabascan Unemployment Among Ages 16 to 19 years Correlation Chart
The statistical analysis conducted on geographies consisting of 443,198,264 people shows a slight positive correlation between the proportion of Immigrants from South Central Asia and unemployment rate among population between the ages 16 and 19 in the United States with a correlation coefficient (R) of 0.060 and weighted average of 16.2%. Similarly, the statistical analysis conducted on geographies consisting of 45,046,237 people shows a moderate positive correlation between the proportion of Alaskan Athabascans and unemployment rate among population between the ages 16 and 19 in the United States with a correlation coefficient (R) of 0.477 and weighted average of 17.7%, a difference of 9.1%.
Unemployment Among Ages 16 to 19 years Correlation Summary
| Measurement | Immigrants from South Central Asia | Alaskan Athabascan |
| Minimum | 2.2% | 9.0% |
| Maximum | 48.9% | 56.0% |
| Range | 46.7% | 47.0% |
| Mean | 16.0% | 22.9% |
| Median | 15.1% | 20.2% |
| Interquartile 25% (IQ1) | 11.9% | 15.9% |
| Interquartile 75% (IQ3) | 17.1% | 26.4% |
| Interquartile Range (IQR) | 5.3% | 10.5% |
| Standard Deviation (Sample) | 7.5% | 11.9% |
| Standard Deviation (Population) | 7.4% | 11.6% |
Similar Demographics by Unemployment Among Ages 16 to 19 years
Demographics Similar to Immigrants from South Central Asia by Unemployment Among Ages 16 to 19 years
In terms of unemployment among ages 16 to 19 years, the demographic groups most similar to Immigrants from South Central Asia are Scottish (16.2%, a difference of 0.010%), Immigrants from Congo (16.3%, a difference of 0.10%), Bulgarian (16.3%, a difference of 0.12%), Pennsylvania German (16.2%, a difference of 0.16%), and Immigrants from Kenya (16.2%, a difference of 0.19%).
| Demographics | Rating | Rank | Unemployment Among Ages 16 to 19 years |
| Chinese | 99.9 /100 | #29 | Exceptional 16.0% |
| Kenyans | 99.9 /100 | #30 | Exceptional 16.1% |
| English | 99.9 /100 | #31 | Exceptional 16.1% |
| Europeans | 99.9 /100 | #32 | Exceptional 16.1% |
| Immigrants | Kenya | 99.9 /100 | #33 | Exceptional 16.2% |
| Pennsylvania Germans | 99.9 /100 | #34 | Exceptional 16.2% |
| Scottish | 99.8 /100 | #35 | Exceptional 16.2% |
| Immigrants | South Central Asia | 99.8 /100 | #36 | Exceptional 16.2% |
| Immigrants | Congo | 99.8 /100 | #37 | Exceptional 16.3% |
| Bulgarians | 99.8 /100 | #38 | Exceptional 16.3% |
| Croatians | 99.8 /100 | #39 | Exceptional 16.3% |
| Hmong | 99.8 /100 | #40 | Exceptional 16.3% |
| Immigrants | Nepal | 99.8 /100 | #41 | Exceptional 16.3% |
| Fijians | 99.8 /100 | #42 | Exceptional 16.3% |
| Immigrants | Lebanon | 99.8 /100 | #43 | Exceptional 16.3% |
Demographics Similar to Alaskan Athabascans by Unemployment Among Ages 16 to 19 years
In terms of unemployment among ages 16 to 19 years, the demographic groups most similar to Alaskan Athabascans are Immigrants from Peru (17.7%, a difference of 0.16%), Immigrants from Czechoslovakia (17.8%, a difference of 0.23%), Peruvian (17.7%, a difference of 0.24%), Ethiopian (17.8%, a difference of 0.24%), and Immigrants from Ireland (17.8%, a difference of 0.30%).
| Demographics | Rating | Rank | Unemployment Among Ages 16 to 19 years |
| Immigrants | Europe | 41.8 /100 | #189 | Average 17.6% |
| Marshallese | 41.7 /100 | #190 | Average 17.6% |
| Immigrants | Costa Rica | 41.3 /100 | #191 | Average 17.6% |
| Immigrants | Philippines | 40.7 /100 | #192 | Average 17.7% |
| Immigrants | Australia | 40.6 /100 | #193 | Average 17.7% |
| Peruvians | 38.8 /100 | #194 | Fair 17.7% |
| Immigrants | Peru | 37.3 /100 | #195 | Fair 17.7% |
| Alaskan Athabascans | 34.1 /100 | #196 | Fair 17.7% |
| Immigrants | Czechoslovakia | 29.8 /100 | #197 | Fair 17.8% |
| Ethiopians | 29.6 /100 | #198 | Fair 17.8% |
| Immigrants | Ireland | 28.5 /100 | #199 | Fair 17.8% |
| Immigrants | Fiji | 27.7 /100 | #200 | Fair 17.8% |
| Immigrants | Ethiopia | 27.4 /100 | #201 | Fair 17.8% |
| Immigrants | Portugal | 27.2 /100 | #202 | Fair 17.8% |
| Immigrants | Eastern Europe | 23.6 /100 | #203 | Fair 17.8% |