Immigrants from South America vs Yup'ik Unemployment Among Ages 55 to 59 years
COMPARE
Immigrants from South America
Yup'ik
Unemployment Among Ages 55 to 59 years
Unemployment Among Ages 55 to 59 years Comparison
Immigrants from South America
Yup'ik
4.9%
UNEMPLOYMENT AMONG AGES 55 TO 59 YEARS
23.1/ 100
METRIC RATING
201st/ 347
METRIC RANK
13.9%
UNEMPLOYMENT AMONG AGES 55 TO 59 YEARS
0.0/ 100
METRIC RATING
347th/ 347
METRIC RANK
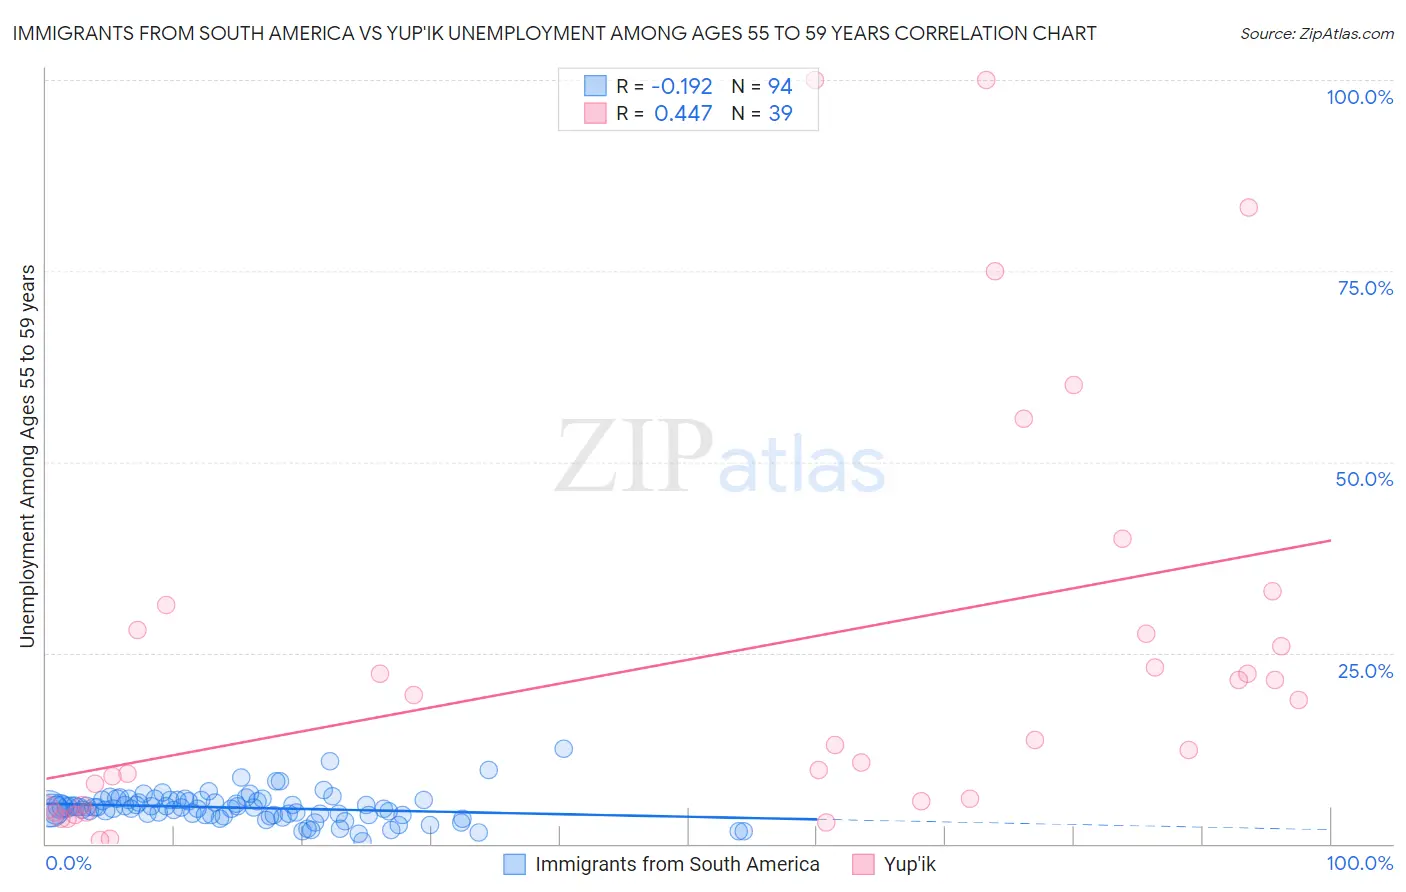
Immigrants from South America vs Yup'ik Unemployment Among Ages 55 to 59 years Correlation Chart
The statistical analysis conducted on geographies consisting of 440,720,372 people shows a poor negative correlation between the proportion of Immigrants from South America and unemployment rate among population between the ages 55 and 59 in the United States with a correlation coefficient (R) of -0.192 and weighted average of 4.9%. Similarly, the statistical analysis conducted on geographies consisting of 39,073,104 people shows a moderate positive correlation between the proportion of Yup'ik and unemployment rate among population between the ages 55 and 59 in the United States with a correlation coefficient (R) of 0.447 and weighted average of 13.9%, a difference of 185.7%.
Unemployment Among Ages 55 to 59 years Correlation Summary
| Measurement | Immigrants from South America | Yup'ik |
| Minimum | 0.40% | 0.49% |
| Maximum | 12.4% | 100.0% |
| Range | 12.0% | 99.5% |
| Mean | 4.7% | 24.0% |
| Median | 4.7% | 13.6% |
| Interquartile 25% (IQ1) | 3.8% | 5.0% |
| Interquartile 75% (IQ3) | 5.7% | 28.0% |
| Interquartile Range (IQR) | 1.9% | 23.0% |
| Standard Deviation (Sample) | 1.9% | 26.6% |
| Standard Deviation (Population) | 1.9% | 26.3% |
Similar Demographics by Unemployment Among Ages 55 to 59 years
Demographics Similar to Immigrants from South America by Unemployment Among Ages 55 to 59 years
In terms of unemployment among ages 55 to 59 years, the demographic groups most similar to Immigrants from South America are Basque (4.9%, a difference of 0.010%), Immigrants from Russia (4.9%, a difference of 0.030%), Lumbee (4.9%, a difference of 0.030%), Guamanian/Chamorro (4.9%, a difference of 0.13%), and Immigrants from Philippines (4.9%, a difference of 0.17%).
| Demographics | Rating | Rank | Unemployment Among Ages 55 to 59 years |
| Spaniards | 27.2 /100 | #194 | Fair 4.9% |
| Estonians | 27.2 /100 | #195 | Fair 4.9% |
| Eastern Europeans | 26.7 /100 | #196 | Fair 4.9% |
| Macedonians | 26.4 /100 | #197 | Fair 4.9% |
| Immigrants | Philippines | 26.1 /100 | #198 | Fair 4.9% |
| Immigrants | Russia | 23.7 /100 | #199 | Fair 4.9% |
| Basques | 23.3 /100 | #200 | Fair 4.9% |
| Immigrants | South America | 23.1 /100 | #201 | Fair 4.9% |
| Lumbee | 22.5 /100 | #202 | Fair 4.9% |
| Guamanians/Chamorros | 20.8 /100 | #203 | Fair 4.9% |
| Immigrants | Latvia | 18.5 /100 | #204 | Poor 4.9% |
| Haitians | 18.1 /100 | #205 | Poor 4.9% |
| Immigrants | Belarus | 14.1 /100 | #206 | Poor 4.9% |
| Immigrants | Australia | 14.1 /100 | #207 | Poor 4.9% |
| Immigrants | Kazakhstan | 14.0 /100 | #208 | Poor 4.9% |
Demographics Similar to Yup'ik by Unemployment Among Ages 55 to 59 years
In terms of unemployment among ages 55 to 59 years, the demographic groups most similar to Yup'ik are Menominee (10.5%, a difference of 32.2%), Tohono O'odham (9.3%, a difference of 49.6%), Inupiat (9.0%, a difference of 54.2%), Yakama (8.9%, a difference of 56.0%), and Hopi (8.1%, a difference of 71.6%).
| Demographics | Rating | Rank | Unemployment Among Ages 55 to 59 years |
| Pima | 0.0 /100 | #333 | Tragic 6.6% |
| Pueblo | 0.0 /100 | #334 | Tragic 6.7% |
| Colville | 0.0 /100 | #335 | Tragic 6.7% |
| Navajo | 0.0 /100 | #336 | Tragic 6.7% |
| Paiute | 0.0 /100 | #337 | Tragic 6.8% |
| Immigrants | Yemen | 0.0 /100 | #338 | Tragic 6.9% |
| Puerto Ricans | 0.0 /100 | #339 | Tragic 7.0% |
| Alaskan Athabascans | 0.0 /100 | #340 | Tragic 7.1% |
| Shoshone | 0.0 /100 | #341 | Tragic 7.4% |
| Hopi | 0.0 /100 | #342 | Tragic 8.1% |
| Yakama | 0.0 /100 | #343 | Tragic 8.9% |
| Inupiat | 0.0 /100 | #344 | Tragic 9.0% |
| Tohono O'odham | 0.0 /100 | #345 | Tragic 9.3% |
| Menominee | 0.0 /100 | #346 | Tragic 10.5% |
| Yup'ik | 0.0 /100 | #347 | Tragic 13.9% |