Immigrants from Somalia vs Brazilian Unemployment Among Seniors over 75 years
COMPARE
Immigrants from Somalia
Brazilian
Unemployment Among Seniors over 75 years
Unemployment Among Seniors over 75 years Comparison
Immigrants from Somalia
Brazilians
8.8%
UNEMPLOYMENT AMONG SENIORS OVER 75 YEARS
41.7/ 100
METRIC RATING
180th/ 347
METRIC RANK
9.3%
UNEMPLOYMENT AMONG SENIORS OVER 75 YEARS
1.3/ 100
METRIC RATING
256th/ 347
METRIC RANK
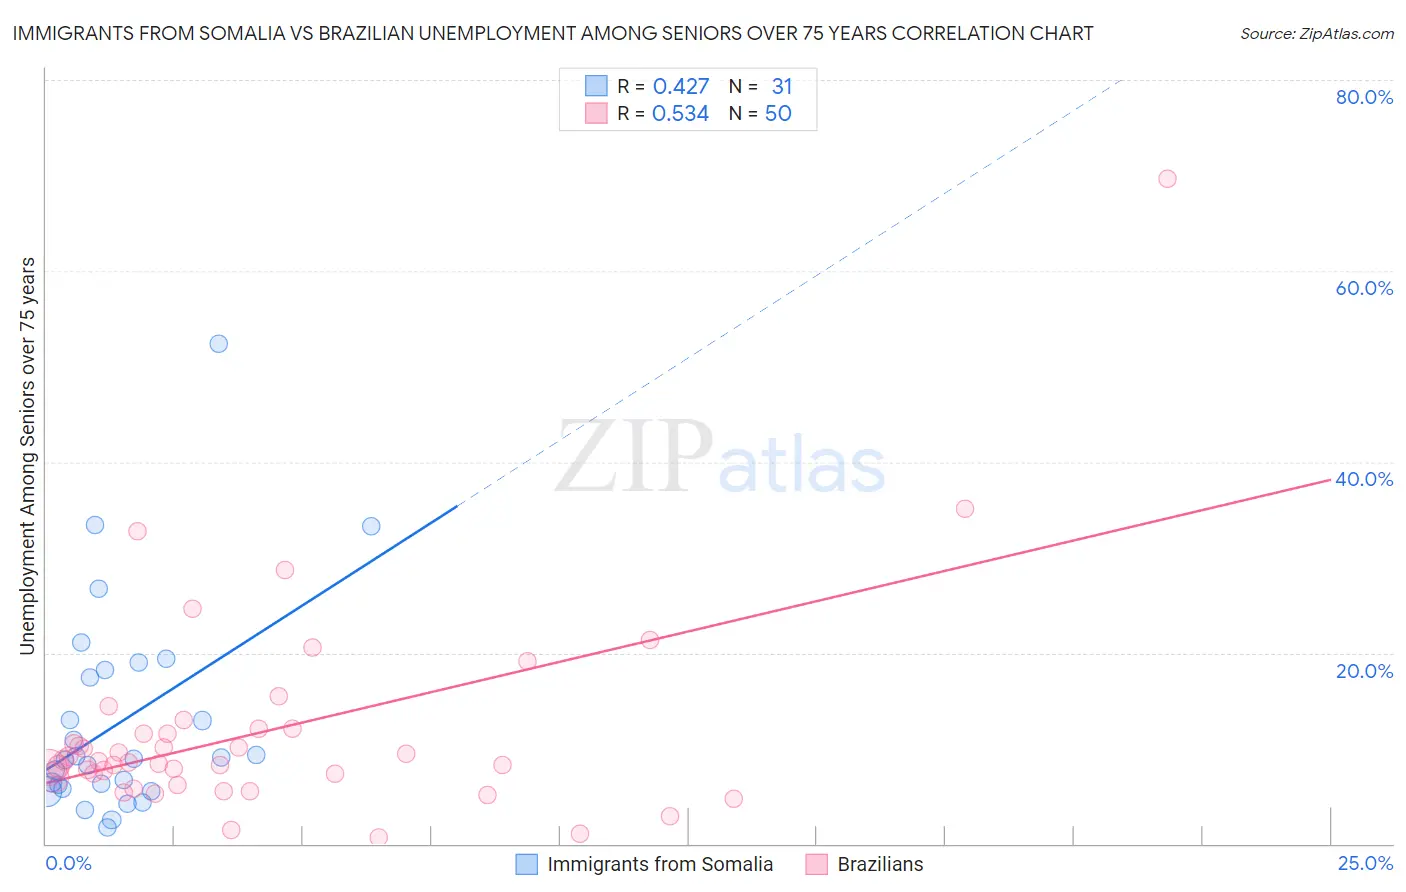
Immigrants from Somalia vs Brazilian Unemployment Among Seniors over 75 years Correlation Chart
The statistical analysis conducted on geographies consisting of 68,154,047 people shows a moderate positive correlation between the proportion of Immigrants from Somalia and unemployment rate among seniors over the age of 75 in the United States with a correlation coefficient (R) of 0.427 and weighted average of 8.8%. Similarly, the statistical analysis conducted on geographies consisting of 180,359,219 people shows a substantial positive correlation between the proportion of Brazilians and unemployment rate among seniors over the age of 75 in the United States with a correlation coefficient (R) of 0.534 and weighted average of 9.3%, a difference of 5.3%.
Unemployment Among Seniors over 75 years Correlation Summary
| Measurement | Immigrants from Somalia | Brazilian |
| Minimum | 1.7% | 0.60% |
| Maximum | 52.4% | 69.7% |
| Range | 50.7% | 69.1% |
| Mean | 12.8% | 11.8% |
| Median | 8.9% | 8.6% |
| Interquartile 25% (IQ1) | 5.8% | 6.9% |
| Interquartile 75% (IQ3) | 18.2% | 12.0% |
| Interquartile Range (IQR) | 12.4% | 5.1% |
| Standard Deviation (Sample) | 11.1% | 11.1% |
| Standard Deviation (Population) | 10.9% | 11.0% |
Similar Demographics by Unemployment Among Seniors over 75 years
Demographics Similar to Immigrants from Somalia by Unemployment Among Seniors over 75 years
In terms of unemployment among seniors over 75 years, the demographic groups most similar to Immigrants from Somalia are Immigrants from Italy (8.8%, a difference of 0.0%), West Indian (8.8%, a difference of 0.010%), Immigrants from Thailand (8.8%, a difference of 0.080%), Central American (8.8%, a difference of 0.090%), and Guatemalan (8.8%, a difference of 0.12%).
| Demographics | Rating | Rank | Unemployment Among Seniors over 75 years |
| Australians | 50.3 /100 | #173 | Average 8.7% |
| Immigrants | El Salvador | 49.7 /100 | #174 | Average 8.7% |
| Syrians | 49.6 /100 | #175 | Average 8.7% |
| Somalis | 45.3 /100 | #176 | Average 8.8% |
| Central Americans | 43.3 /100 | #177 | Average 8.8% |
| West Indians | 41.9 /100 | #178 | Average 8.8% |
| Immigrants | Italy | 41.7 /100 | #179 | Average 8.8% |
| Immigrants | Somalia | 41.7 /100 | #180 | Average 8.8% |
| Immigrants | Thailand | 40.2 /100 | #181 | Average 8.8% |
| Guatemalans | 39.5 /100 | #182 | Fair 8.8% |
| Immigrants | Afghanistan | 38.2 /100 | #183 | Fair 8.8% |
| Immigrants | Micronesia | 37.2 /100 | #184 | Fair 8.8% |
| Choctaw | 37.1 /100 | #185 | Fair 8.8% |
| Immigrants | Ethiopia | 36.2 /100 | #186 | Fair 8.8% |
| Immigrants | Europe | 35.2 /100 | #187 | Fair 8.8% |
Demographics Similar to Brazilians by Unemployment Among Seniors over 75 years
In terms of unemployment among seniors over 75 years, the demographic groups most similar to Brazilians are Hawaiian (9.3%, a difference of 0.12%), Immigrants from Scotland (9.2%, a difference of 0.15%), Immigrants from England (9.3%, a difference of 0.27%), Slovene (9.3%, a difference of 0.28%), and Immigrants from Cameroon (9.3%, a difference of 0.33%).
| Demographics | Rating | Rank | Unemployment Among Seniors over 75 years |
| Immigrants | Saudi Arabia | 2.2 /100 | #249 | Tragic 9.2% |
| Central American Indians | 2.2 /100 | #250 | Tragic 9.2% |
| Immigrants | Poland | 2.0 /100 | #251 | Tragic 9.2% |
| Immigrants | Sudan | 2.0 /100 | #252 | Tragic 9.2% |
| Pima | 1.8 /100 | #253 | Tragic 9.2% |
| Immigrants | Ghana | 1.7 /100 | #254 | Tragic 9.2% |
| Immigrants | Scotland | 1.4 /100 | #255 | Tragic 9.2% |
| Brazilians | 1.3 /100 | #256 | Tragic 9.3% |
| Hawaiians | 1.2 /100 | #257 | Tragic 9.3% |
| Immigrants | England | 1.0 /100 | #258 | Tragic 9.3% |
| Slovenes | 1.0 /100 | #259 | Tragic 9.3% |
| Immigrants | Cameroon | 1.0 /100 | #260 | Tragic 9.3% |
| Celtics | 0.8 /100 | #261 | Tragic 9.3% |
| Austrians | 0.7 /100 | #262 | Tragic 9.3% |
| Ukrainians | 0.7 /100 | #263 | Tragic 9.3% |