Immigrants from Singapore vs Haitian Unemployment Among Ages 25 to 29 years
COMPARE
Immigrants from Singapore
Haitian
Unemployment Among Ages 25 to 29 years
Unemployment Among Ages 25 to 29 years Comparison
Immigrants from Singapore
Haitians
5.9%
UNEMPLOYMENT AMONG AGES 25 TO 29 YEARS
99.9/ 100
METRIC RATING
18th/ 347
METRIC RANK
8.0%
UNEMPLOYMENT AMONG AGES 25 TO 29 YEARS
0.0/ 100
METRIC RATING
306th/ 347
METRIC RANK
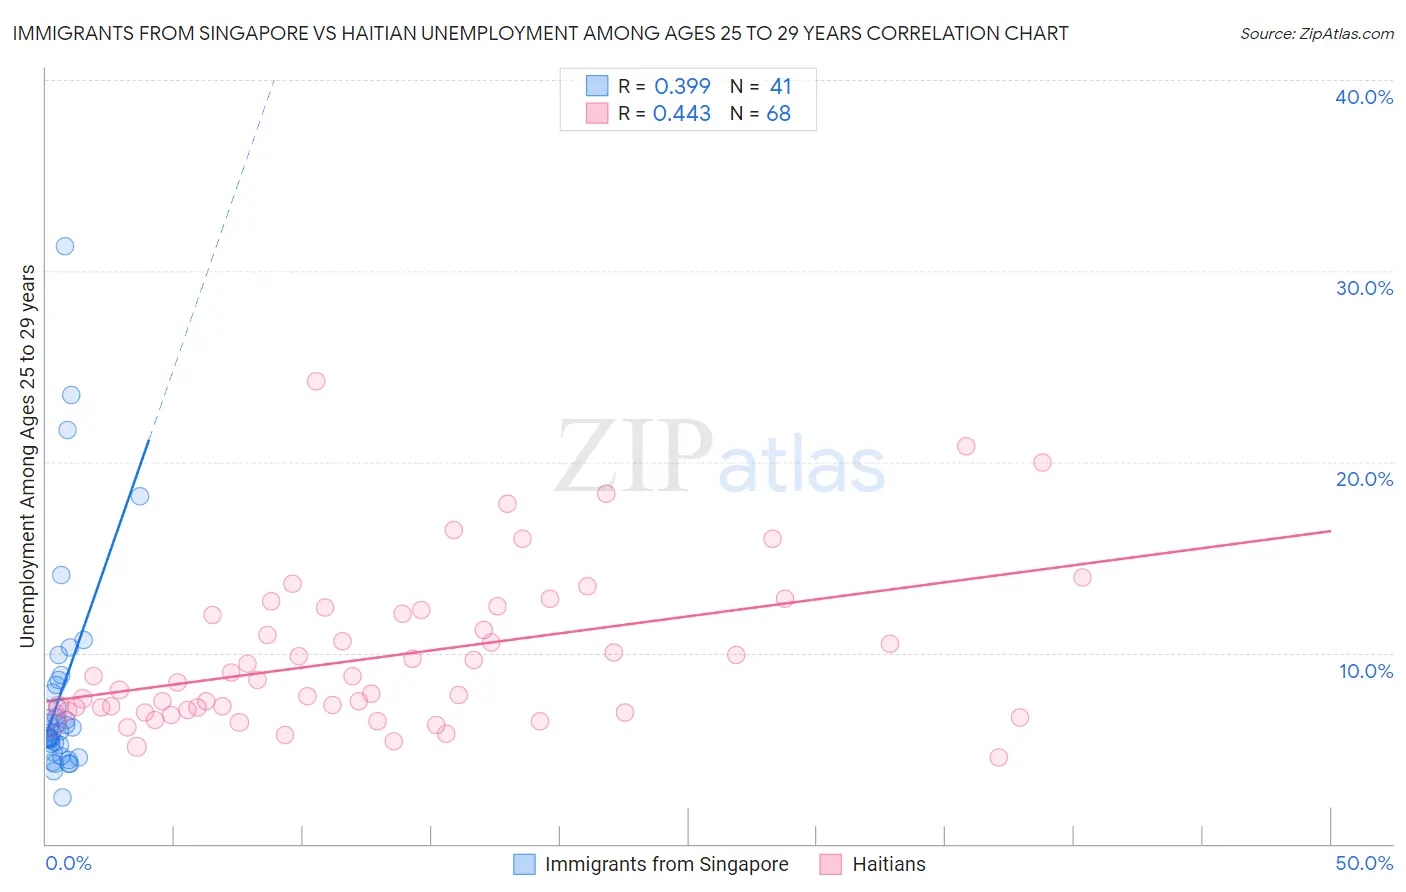
Immigrants from Singapore vs Haitian Unemployment Among Ages 25 to 29 years Correlation Chart
The statistical analysis conducted on geographies consisting of 134,874,322 people shows a mild positive correlation between the proportion of Immigrants from Singapore and unemployment rate among population between the ages 25 and 29 in the United States with a correlation coefficient (R) of 0.399 and weighted average of 5.9%. Similarly, the statistical analysis conducted on geographies consisting of 278,147,235 people shows a moderate positive correlation between the proportion of Haitians and unemployment rate among population between the ages 25 and 29 in the United States with a correlation coefficient (R) of 0.443 and weighted average of 8.0%, a difference of 35.6%.
Unemployment Among Ages 25 to 29 years Correlation Summary
| Measurement | Immigrants from Singapore | Haitian |
| Minimum | 2.4% | 4.5% |
| Maximum | 31.3% | 24.2% |
| Range | 28.9% | 19.7% |
| Mean | 8.0% | 9.8% |
| Median | 5.9% | 8.5% |
| Interquartile 25% (IQ1) | 5.0% | 7.0% |
| Interquartile 75% (IQ3) | 8.4% | 12.2% |
| Interquartile Range (IQR) | 3.5% | 5.2% |
| Standard Deviation (Sample) | 5.9% | 4.1% |
| Standard Deviation (Population) | 5.8% | 4.1% |
Similar Demographics by Unemployment Among Ages 25 to 29 years
Demographics Similar to Immigrants from Singapore by Unemployment Among Ages 25 to 29 years
In terms of unemployment among ages 25 to 29 years, the demographic groups most similar to Immigrants from Singapore are Bolivian (5.9%, a difference of 0.11%), Thai (5.9%, a difference of 0.15%), Immigrants from Bulgaria (5.9%, a difference of 0.25%), Cuban (5.9%, a difference of 0.26%), and Immigrants from Eritrea (5.9%, a difference of 0.34%).
| Demographics | Rating | Rank | Unemployment Among Ages 25 to 29 years |
| Cambodians | 100.0 /100 | #11 | Exceptional 5.8% |
| Okinawans | 100.0 /100 | #12 | Exceptional 5.9% |
| Immigrants | Bolivia | 100.0 /100 | #13 | Exceptional 5.9% |
| Immigrants | Kuwait | 99.9 /100 | #14 | Exceptional 5.9% |
| Cubans | 99.9 /100 | #15 | Exceptional 5.9% |
| Immigrants | Bulgaria | 99.9 /100 | #16 | Exceptional 5.9% |
| Bolivians | 99.9 /100 | #17 | Exceptional 5.9% |
| Immigrants | Singapore | 99.9 /100 | #18 | Exceptional 5.9% |
| Thais | 99.9 /100 | #19 | Exceptional 5.9% |
| Immigrants | Eritrea | 99.9 /100 | #20 | Exceptional 5.9% |
| Immigrants | Ethiopia | 99.9 /100 | #21 | Exceptional 6.0% |
| Immigrants | Japan | 99.9 /100 | #22 | Exceptional 6.0% |
| Immigrants | Venezuela | 99.8 /100 | #23 | Exceptional 6.0% |
| Norwegians | 99.8 /100 | #24 | Exceptional 6.0% |
| New Zealanders | 99.8 /100 | #25 | Exceptional 6.0% |
Demographics Similar to Haitians by Unemployment Among Ages 25 to 29 years
In terms of unemployment among ages 25 to 29 years, the demographic groups most similar to Haitians are Tsimshian (8.0%, a difference of 0.080%), Immigrants from Barbados (8.0%, a difference of 0.16%), Cajun (8.0%, a difference of 0.34%), Immigrants from Yemen (8.0%, a difference of 0.56%), and Immigrants from Jamaica (8.1%, a difference of 0.58%).
| Demographics | Rating | Rank | Unemployment Among Ages 25 to 29 years |
| Barbadians | 0.0 /100 | #299 | Tragic 7.9% |
| Central American Indians | 0.0 /100 | #300 | Tragic 7.9% |
| West Indians | 0.0 /100 | #301 | Tragic 7.9% |
| Jamaicans | 0.0 /100 | #302 | Tragic 7.9% |
| Immigrants | Yemen | 0.0 /100 | #303 | Tragic 8.0% |
| Cajuns | 0.0 /100 | #304 | Tragic 8.0% |
| Tsimshian | 0.0 /100 | #305 | Tragic 8.0% |
| Haitians | 0.0 /100 | #306 | Tragic 8.0% |
| Immigrants | Barbados | 0.0 /100 | #307 | Tragic 8.0% |
| Immigrants | Jamaica | 0.0 /100 | #308 | Tragic 8.1% |
| Immigrants | Haiti | 0.0 /100 | #309 | Tragic 8.1% |
| U.S. Virgin Islanders | 0.0 /100 | #310 | Tragic 8.1% |
| Immigrants | Azores | 0.0 /100 | #311 | Tragic 8.1% |
| Dutch West Indians | 0.0 /100 | #312 | Tragic 8.2% |
| Immigrants | St. Vincent and the Grenadines | 0.0 /100 | #313 | Tragic 8.4% |